
Lat/Lon data with background map#
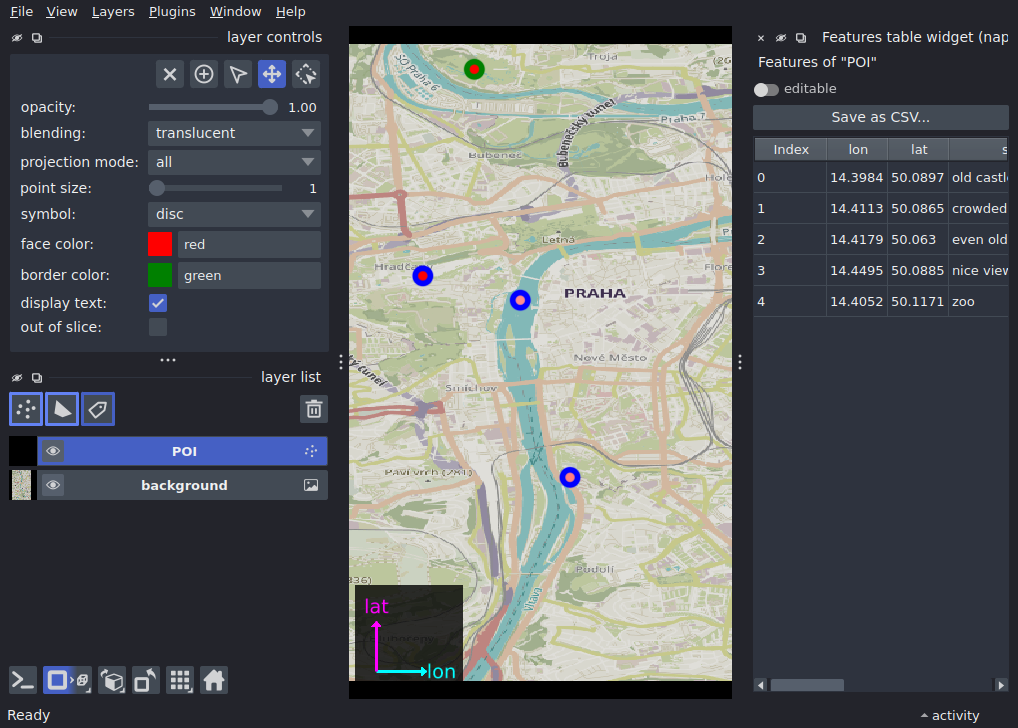
For a given set of points of interest (POI) with lat/lon coordinates, download a background map from contextily and display it in napari together with the POI. Requires geopandas and contextily to be installed.
Extra packages required
This example requires additional packages that are not available in typical
napari installations.
For this example to work in recommended napari installations,
you will need to install additional packages: contextily, geopandas.
See the plugin manager guide
for ways to install additional packages from within napari.
import contextily as ctx
import geopandas as gpd
import pandas as pd
import zarr
from requests.exceptions import HTTPError

import napari

# some point of interest with lat/lon coordinates and a description
df = pd.DataFrame([
    {'lon': 14.3983569, 'lat': 50.0897206,
     'sight': 'old castle', 'nature': False, 'stars': 5.0},
    {'lon': 14.4112958, 'lat': 50.0864922,
     'sight': 'crowded bridge', 'nature': False, 'stars': 4.0},
    {'lon': 14.4178942, 'lat': 50.0629778,
     'sight': 'even older castle', 'nature': False, 'stars': 4.1},
    {'lon': 14.4495206, 'lat': 50.0884767,
     'sight': 'nice view from here', 'nature': True, 'stars': 3.2},
    {'lon': 14.4052019, 'lat': 50.1171367,
     'sight': 'zoo', 'nature': True, 'stars': 5.0},
])
gdf = gpd.GeoDataFrame(
        df, geometry=gpd.points_from_xy(df.lon, df.lat), crs='EPSG:4326'
        )
# convert coordinates

# convert bounds from crs=4326 (World Geodetic System 1984)
# to crs=3857 (Web Mercator)
boundsWgs84 = gdf.total_bounds
# make a dataframe with the points
corners = gpd.GeoDataFrame(
                geometry=gpd.points_from_xy(
                        [boundsWgs84[0], boundsWgs84[2]],
                        [boundsWgs84[1], boundsWgs84[3]],
                        crs=4326,
                        )
                )
# convert to new CRS and get the new bounds
bounds = gpd.GeoSeries(corners.to_crs(3857).geometry).total_bounds

# get the background map from contextily, OR, because sometimes OSM's API
# fails, perhaps because CI is spamming the API, fall back on napari test data.
try:
    bg_map, bg_extent = ctx.bounds2img(*bounds, zoom=13)
except (ConnectionError, HTTPError):
    bg_map = zarr.open('https://data.napari.dev/prague-map.zarr')
    bg_extent = (
            1599674.1279521685, 1609458.067572671,
            6452508.179721437, 6467184.089152193,
            )

# convert the true bounds of the downloaded map to WGS84 (crs=4326) coordinates
bounds_map_wm_df = gpd.GeoDataFrame(
        geometry=gpd.points_from_xy(
                [bg_extent[0], bg_extent[1]],
                [bg_extent[2], bg_extent[3]],
                crs=3857,
                )
        )
bounds_map_wgs84 = gpd.GeoSeries(
        bounds_map_wm_df.to_crs(4326).geometry
        ).total_bounds

# display the background map in napari
viewer = napari.Viewer()
viewer.scene.camera.orientation2d = 'up','right'
viewer.canvas.overlays.axes.visible = True
viewer.dims.axis_labels = 'lat','lon'
viewer.window.add_plugin_dock_widget('napari', 'Features table widget')

# add the downloaded background map as an image layer, with the correct
# translation and scale to match the lat/lon coordinates
viewer.add_image(
        bg_map[::-1],  # invert the map so it goes up with latitude
        name='map',
        rgb=True,
        translate=(bounds_map_wgs84[1], bounds_map_wgs84[0]),
        scale=((bounds_map_wgs84[3]-bounds_map_wgs84[1])/bg_map.shape[0],
               (bounds_map_wgs84[2]-bounds_map_wgs84[0])/bg_map.shape[1]),
        )

# add the points of interest as a points layer, using some of the features for
# coloring
points_layer = viewer.add_points(
    data=df[['lat','lon']].to_numpy(),
    features=df,
    border_color='nature',
    border_color_cycle=['blue', 'green'],
    border_width=0.4,
    face_color='stars',
    face_colormap='reds',
    size=0.002,
    name='POI',
)

if __name__ == '__main__':
    napari.run()