Note
Go to the end to download the full example as a Python script or as a Jupyter notebook..
Add vectors#
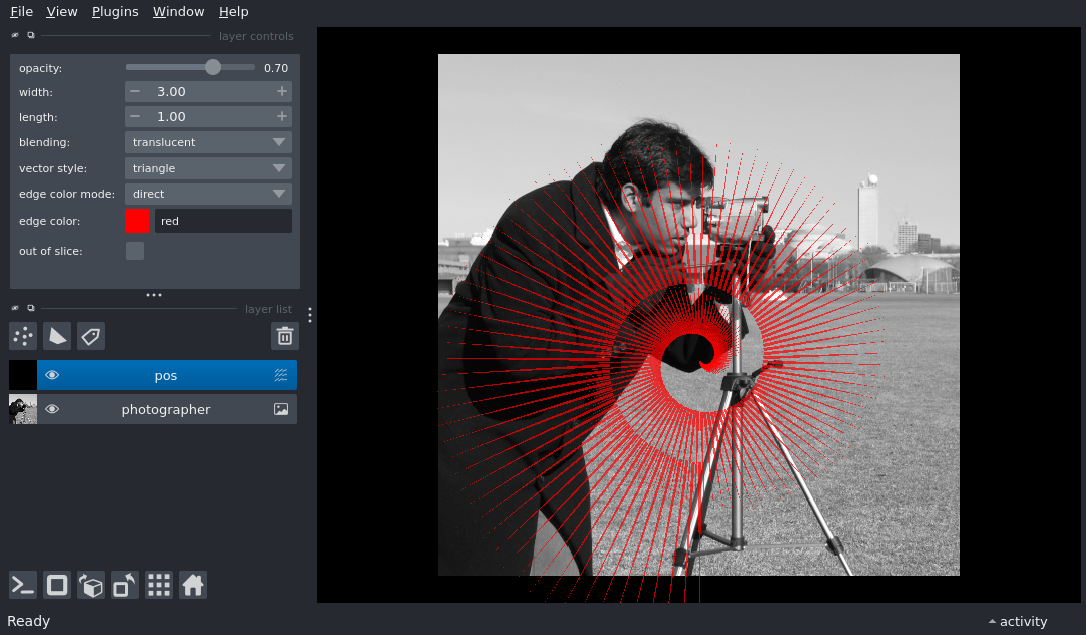
This example generates an image of vectors Vector data is an array of shape (N, 4) Each vector position is defined by an (x, y, x-proj, y-proj) element where * x and y are the center points * x-proj and y-proj are the vector projections at each center

import numpy as np
from skimage import data

import napari

# create the viewer and window
viewer = napari.Viewer()

layer = viewer.add_image(data.camera(), name='photographer')

# sample vector coord-like data
n = 200
pos = np.zeros((n, 2, 2), dtype=np.float32)
phi_space = np.linspace(0, 4 * np.pi, n)
radius_space = np.linspace(0, 100, n)

# assign x-y position
pos[:, 0, 0] = radius_space * np.cos(phi_space) + 300
pos[:, 0, 1] = radius_space * np.sin(phi_space) + 256

# assign x-y projection
pos[:, 1, 0] = 2 * radius_space * np.cos(phi_space)
pos[:, 1, 1] = 2 * radius_space * np.sin(phi_space)

# add the vectors
layer = viewer.add_vectors(pos, edge_width=3)

if __name__ == '__main__':
    napari.run()