Mouse drag callback#
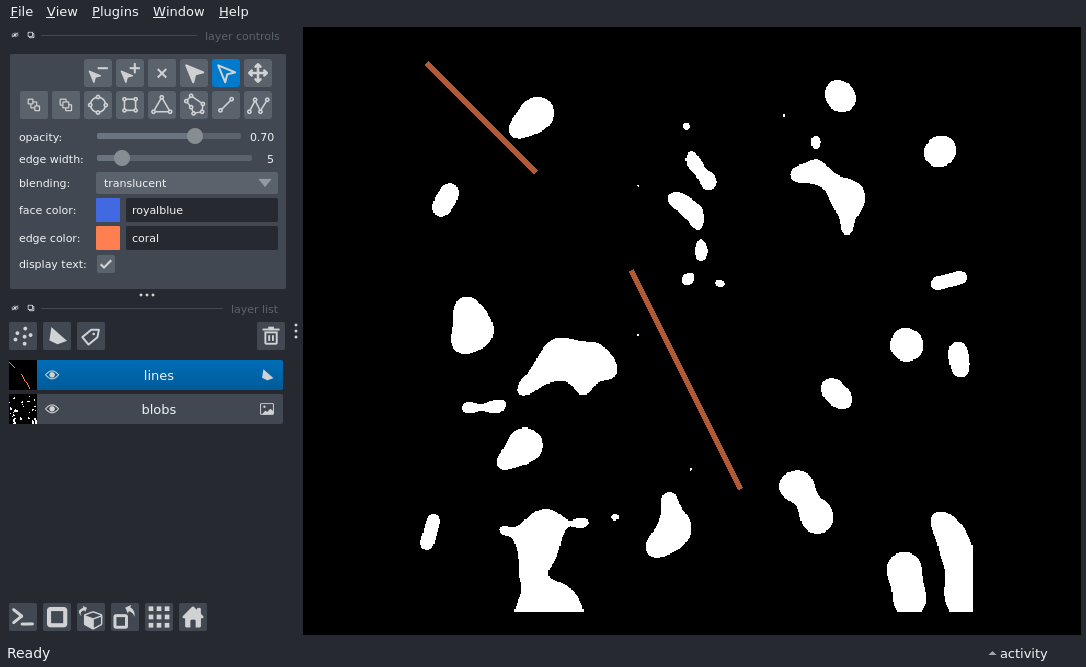
This example shows how to use a mouse drag callback in Napari to compute and print the average intensity along line shapes as they are moved.
As you drag lines over the image, the script calculates the mean of the intensity profile along each line and prints the results to the terminal in real time.
/home/runner/work/docs/docs/.venv/lib/python3.12/site-packages/napari/_qt/qt_event_loop.py:50: UserWarning: System theme detection requires a Qt6 backend. Please switch to PyQt6 or PySide6 to use it.
  theme_type=get_system_theme(),
/home/runner/work/docs/docs/.venv/lib/python3.12/site-packages/napari/_qt/qt_event_loop.py:50: UserWarning: System theme detection requires a Qt6 backend. Please switch to PyQt6 or PySide6 to use it.
  theme_type=get_system_theme(),
import numpy as np
from skimage import data, measure

import napari


def profile_lines(image, shape_layer):
    profile_data = [
        measure.profile_line(image, line[0], line[1], mode='reflect').mean()
        for line in shape_layer.data
    ]
    print(f"profile means: [{', '.join(f'{d:.2f}' for d in profile_data)}]")


np.random.seed(1)
viewer = napari.Viewer()
blobs = data.binary_blobs(length=512, volume_fraction=0.1, n_dim=2)
viewer.add_image(blobs, name='blobs')
line1 = np.array([[11, 13], [111, 113]])
line2 = np.array([[200, 200], [400, 300]])
lines = [line1, line2]
shapes_layer = viewer.add_shapes(
    lines,
    shape_type='line',
    edge_width=5,
    edge_color='coral',
    face_color='royalblue',
)
shapes_layer.mode = 'select'


@shapes_layer.mouse_drag_callbacks.append
def profile_lines_drag(layer, event):
    profile_lines(blobs, layer)
    yield
    while event.type == 'mouse_move':
        profile_lines(blobs, layer)
        # the yield statement allows the mouse UI to keep working while
        # this loop is executed repeatedly
        yield


if __name__ == '__main__':
    napari.run()