Glasbey colormap#
A long-requested feature [1] for napari was to display labels/segmentation layers using a well-known discrete colormap such as Glasbey [2].
In this example, we demonstrate displaying segmentations using custom colormaps with the help of the glasbey Python library [3], which you can install with your favorite Python package manager, such as pip or conda. We display a segmentation using the napari built-in labels colormap, the original Glasbey colormap, a more modern version produced by limiting the lightness and chroma and optimizing for colorblind-safety, and finally with the matplotlib tab10 colormap.
Extra packages required
This example requires additional packages that are not available in typical
napari installations.
For this example to work in recommended napari installations,
you will need to install additional packages: glasbey.
See the plugin manager guide
for ways to install additional packages from within napari.
import glasbey
import numpy as np
from skimage import data
from skimage.filters import threshold_otsu
from skimage.measure import label
from skimage.morphology import closing, remove_small_objects
from skimage.segmentation import clear_border

import napari

image = data.coins()[50:-50, 50:-50]
/home/runner/work/docs/docs/.venv/lib/python3.12/site-packages/colorspacious/comparison.py:11: SyntaxWarning: invalid escape sequence '\D'
  """Computes the :math:`\Delta E` distance between pairs of colors.
First, we segment the image.
/home/runner/work/docs/docs/napari/examples/glasbey-colormap.py:44: FutureWarning: Parameter `min_size` is deprecated since version 0.26.0 and will be removed in 2.0.0 (or later). To avoid this warning, please use the parameter `max_size` instead. For more details, see the documentation of `remove_small_objects`. Note that the new threshold removes objects smaller than **or equal to** its value, while the previous parameter only removed smaller ones.
  cleared = remove_small_objects(clear_border(bw), 20)
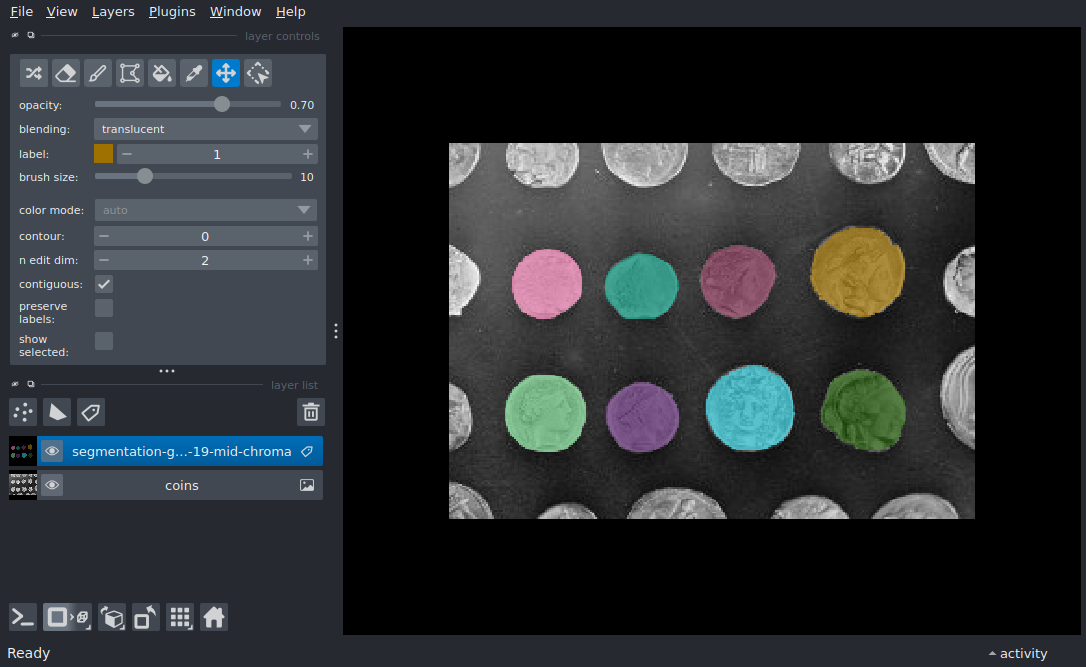
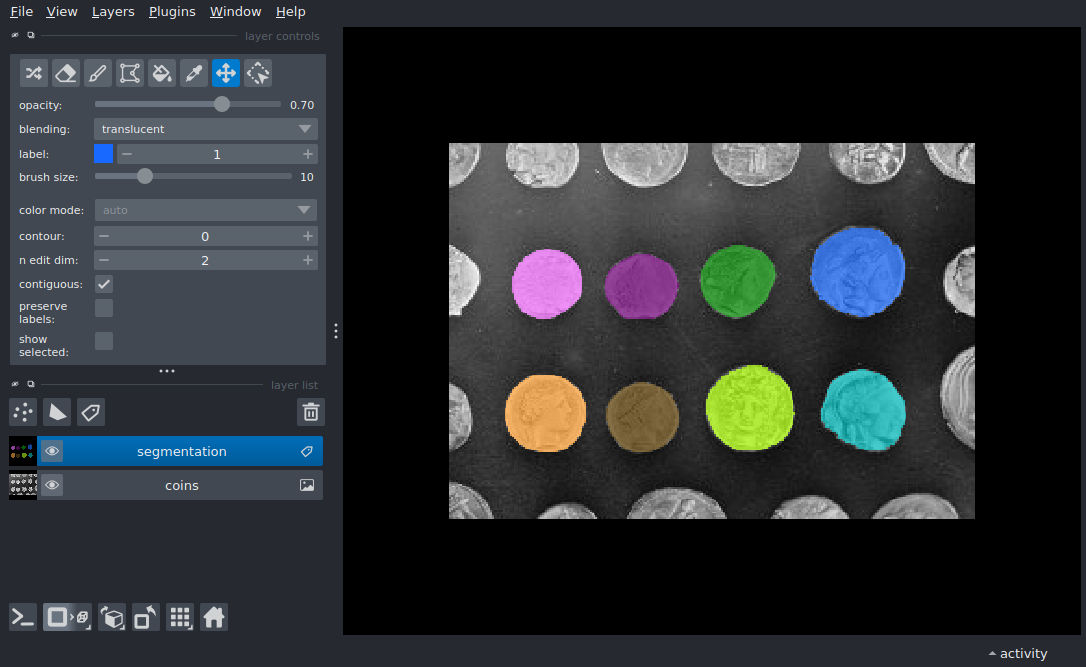
Then, we create two color palettes using the glasbey library. One with the original glasbey parameters and 256 colors, and a more modern one with better lightness and chroma bounds for a less glary look.
Finally, we display the coins image and the overlaid segmentation. We do this in two viewers to show both colormaps.
viewer, image_layer = napari.imshow(image, name='coins')

# add the labels
label_layer_glas = viewer.add_labels(
        label_image, name='segmentation', colormap=glas
        )

viewer2, image_layer2 = napari.imshow(image, name='coins')

label_layer_modern = viewer2.add_labels(
        label_image, name='segmentation-glasbey-19-mid-chroma', colormap=glas19mid,
        )


if __name__ == '__main__':
    napari.run()
/home/runner/work/docs/docs/.venv/lib/python3.12/site-packages/napari/_qt/qt_event_loop.py:50: UserWarning: System theme detection requires a Qt6 backend. Please switch to PyQt6 or PySide6 to use it.
  theme_type=get_system_theme(),
/home/runner/work/docs/docs/.venv/lib/python3.12/site-packages/napari/_qt/qt_event_loop.py:50: UserWarning: System theme detection requires a Qt6 backend. Please switch to PyQt6 or PySide6 to use it.
  theme_type=get_system_theme(),
/home/runner/work/docs/docs/.venv/lib/python3.12/site-packages/napari/_qt/qt_event_loop.py:50: UserWarning: System theme detection requires a Qt6 backend. Please switch to PyQt6 or PySide6 to use it.
  theme_type=get_system_theme(),