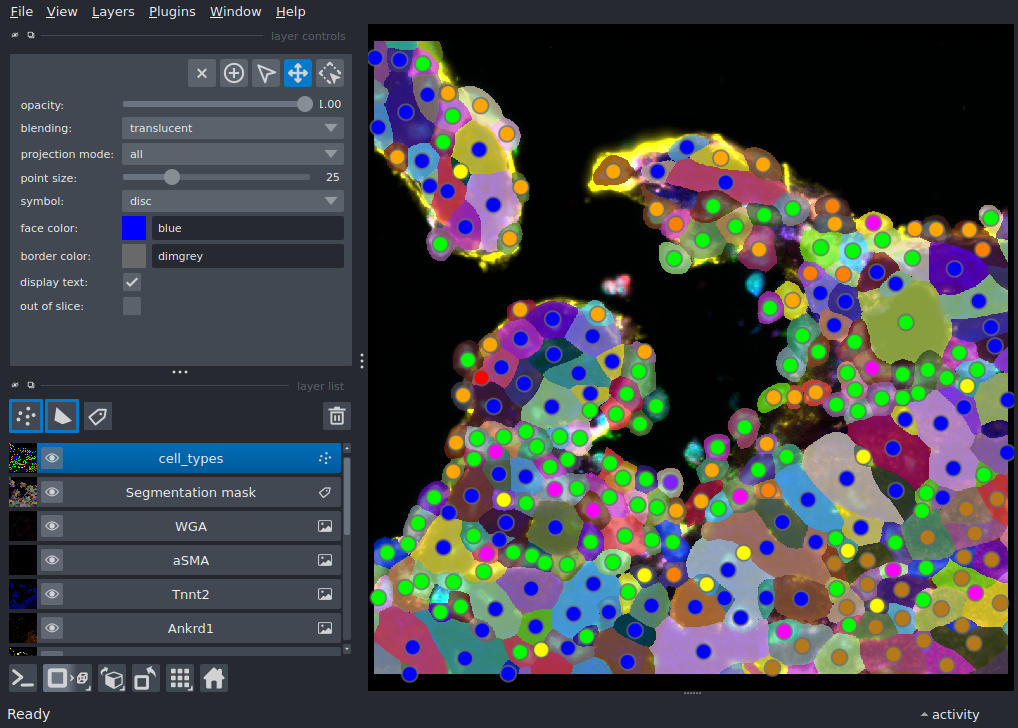
Heart with multiple annotations#
Display a multiplexed immunofluorescent image of a murine heart with preset contrast limits and colormap, as well as a segmentation mask and points with features.
This example demonstrates how to load and display a subset of channels from a multi-channel 2D image with preset contrast limits and colormap. It adds a segmentation mask and points with features.
Thanks to Krešimir Beštak for providing the image, segmentation mask and cell data for this example. The full dataset is available on Synapse: https://www.synapse.org/Synapse:syn51449054
More information about the dataset can be found in Wünnemann, F., Sicklinger, F., Bestak, K. et al. Spatial multiomics of acute myocardial infarction reveals immune cell infiltration through the endocardium. Nat Cardiovasc Res 4, 1345-1362 (2025). https://doi.org/10.1038/s44161-025-00717-y
downloading data into /home/runner/work/docs/docs/.cache/napari-heart-example
/home/runner/work/docs/docs/.venv/lib/python3.12/site-packages/napari/_qt/qt_event_loop.py:50: UserWarning: System theme detection requires a Qt6 backend. Please switch to PyQt6 or PySide6 to use it.
  theme_type=get_system_theme(),
/home/runner/work/docs/docs/.venv/lib/python3.12/site-packages/napari/_qt/qt_event_loop.py:50: UserWarning: System theme detection requires a Qt6 backend. Please switch to PyQt6 or PySide6 to use it.
  theme_type=get_system_theme(),
import dask.array
import pandas as pd
import pooch
import tifffile

import napari

# download the data
url = 'https://data.napari.dev/heart_example_data'
tmp_dir = pooch.os_cache('napari-heart-example')
data_files = {
    #'tiff_image': 'image.tif', # uncomment if you want to load the image as tiff instead of zarr
    'segmentation': 'segmentation.tif',
    'cell_data': 'cell_data.csv',
    'channel_metadata': 'channel_metadata.csv'
}
data_to_path = {}
print(f'downloading data into {tmp_dir}')
for id_, file_name in data_files.items():
    res = pooch.retrieve(
        f'{url}/{file_name}',
        known_hash=None,
        path=tmp_dir,
        progressbar=True
    )
    data_to_path[id_] = res

# read in image, segmentation mask and cell data
# image can be read in either as tiff or as zarr
# image = tifffile.imread(data_to_path['tiff_image'])
# zarr v3 array is streamed lazily over HTTP - no local download needed
image = dask.array.from_zarr(f'{url}/image.zarr')
mask = tifffile.imread(data_to_path['segmentation'])
cells = pd.read_csv(data_to_path['cell_data'])

# read in metadata containing contrast limits, colormap and channel index for each channel that should be included
channel_metadata = pd.read_csv(data_to_path['channel_metadata'])

# define colors for each cell type in the points layer
color_cycle = {
    'Cardiomyocytes': '#0000ff',
    'Cardiomyocytes Ankrd1+': "#b5791a",
    'Macrophages Trem2+':'#01f08a',
    'Fibroblasts': '#ff8000',
    'Endothelial cells': '#ffff00',
    'Mono / Macros Ccr2+':'#00ff00',
    'Neutrophils':'#ff00ff',
    'Smooth muscle cells':'#ff0000',
    'Endocardial cells': '#ffa700',
    'Other Leukocytes':"#7b22ff",
    'Macrophages Trem2-':"#ff0080"
    }

# subset cell features to those that should be added to the points layer
feature = {
    'label': cells['label'],
    'cell_size': cells['cell_size'],
    'cell_type': cells['final_cell_type']
}

# create napari viewer and add image channel by channel with contrast limits and colormap according to channel_metadata
viewer = napari.Viewer()
for idx, name in zip(
    channel_metadata['channel_index'],
    channel_metadata['name'],
    strict = True
):
    viewer.add_image(
        image[idx],
        name=name,
        rgb=False,
        contrast_limits=[
            channel_metadata['contrast_min'][channel_metadata['channel_index'] == idx].values[0],
            channel_metadata['contrast_max'][channel_metadata['channel_index'] == idx].values[0],
        ],
        blending='additive',
        colormap=channel_metadata['colorhex'][channel_metadata['channel_index'] == idx].values[0],
    )

# add segmentation mask
viewer.add_labels(
    mask,
    name='Segmentation mask',
)

# add points with features, colored by cell type
viewer.add_points(
    cells[['Y_centroid', 'X_centroid']].values,
    name='cell_types',
    features=feature,
    face_color='cell_type',
    size=25,
    face_color_cycle=color_cycle
)

if __name__ == '__main__':
    napari.run()