Note
Go to the end to download the full example as a Python script or as a Jupyter notebook..
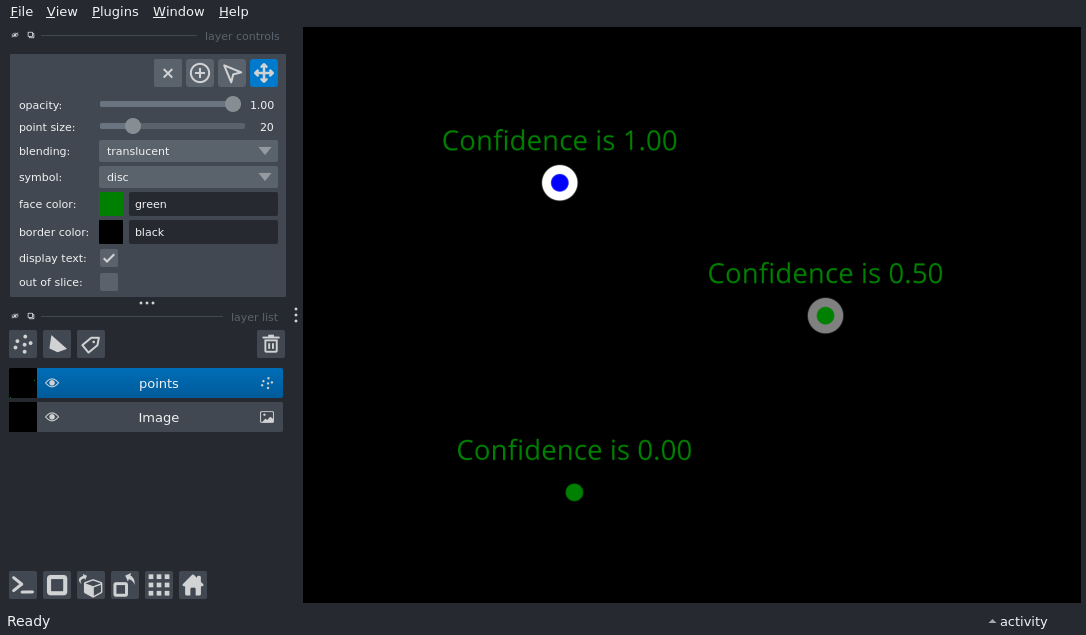
Add points with text#
Display a points layer on top of an image layer using the add_points and
add_image APIs

import numpy as np

import napari

# add the image
viewer = napari.Viewer()
layer = viewer.add_image(np.zeros((400, 400)))
# add the points
points = np.array([[100, 100], [200, 300], [333, 111]])

# create features for each point
features = {
    'confidence': np.array([1, 0.5, 0]),
    'good_point': np.array([True, False, False]),
}

# define the color cycle for the face_color annotation
face_color_cycle = ['blue', 'green']

text = {
    'string': 'Confidence is {confidence:.2f}',
    'size': 20,
    'color': 'green',
    'translation': np.array([-30, 0]),
}

# create a points layer where the face_color is set by the good_point feature
# and the border_color is set via a color map (grayscale) on the confidence
# feature.
points_layer = viewer.add_points(
    points,
    features=features,
    text=text,
    size=20,
    border_width=7,
    border_width_is_relative=False,
    border_color='confidence',
    border_colormap='gray',
    face_color='good_point',
    face_color_cycle=face_color_cycle,
)

# set the border_color mode to colormap
points_layer.border_color_mode = 'colormap'

if __name__ == '__main__':
    napari.run()