
Connect points with vectors#
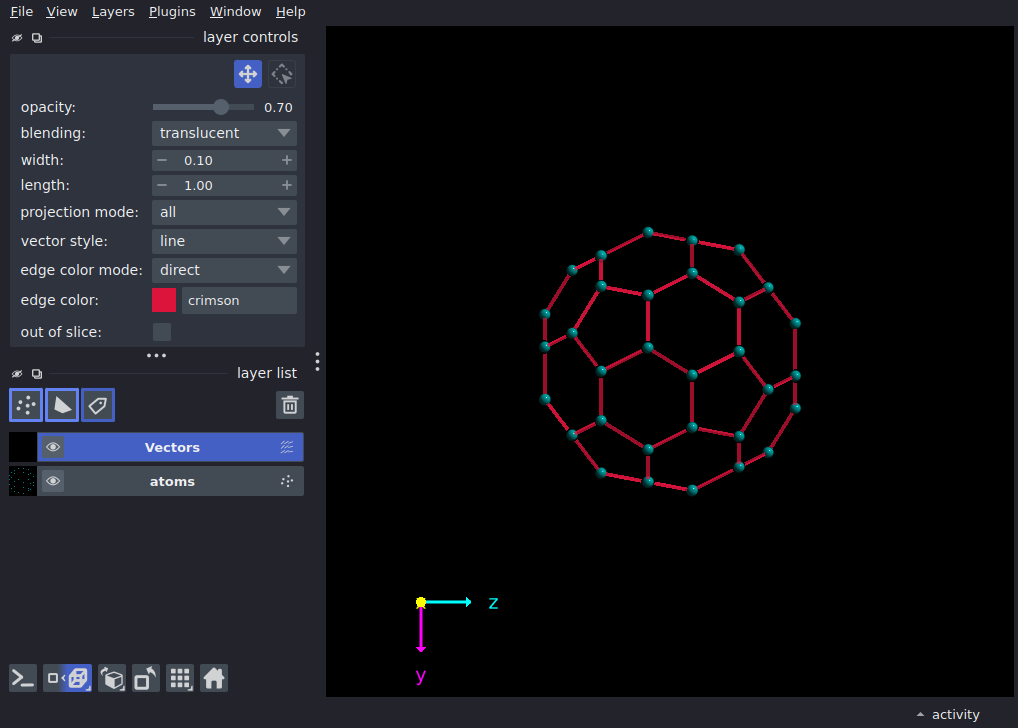
Build a 3D molecular structure using points and vectors layer based on a fullerene C60 (60 carbon atoms molecule). See: https://en.wikipedia.org/wiki/Buckminsterfullerene
Atoms are displayed as spherically shaded points, where the bonds are drawn as vectors between atoms for whose the distance is less than a chosen cutoff value.
Atoms positions are provided while the bonds are derived directly from the coordinates.
If you’d like to read molecular structure files (PDB or MMCIF) in napari, see the napari-molecule-reader: https://napari-hub.org/plugins/napari-molecule-reader.html
import numpy as np

import napari

# C60 fullerene atomic coordinates in Angstroms
# N x D Numpy array for points layer
atoms = np.array([
    [ 0.726656, -1.000157,  3.300459],
    [ 1.175755,  0.382026,  3.300459],
    [ 1.410183, -1.940951,  2.581756],
    [ 2.281725,  0.741377,  2.581756],
    [ 2.281725,  1.977639,  1.817704],
    [ 0.      ,  1.236262,  3.300459],
    [ 0.      ,  2.399147,  2.581756],
    [ 1.175755,  2.781173,  1.817704],
    [-0.683527, -2.941108,  1.817704],
    [-1.410183, -1.940951,  2.581756],
    [ 0.683527, -2.941108,  1.817704],
    [-0.726656, -1.000157,  3.300459],
    [-1.175755,  0.382026,  3.300459],
    [-2.585938, -1.558925,  1.817704],
    [-3.008381, -0.258779,  1.817704],
    [-2.281725,  0.741377,  2.581756],
    [ 0.726656, -3.399304, -0.581443],
    [-0.726656, -3.399304, -0.581443],
    [ 1.410183, -3.177213,  0.581443],
    [-1.410183, -3.177213,  0.581443],
    [-2.585938, -2.322977,  0.581443],
    [-1.175755, -2.781173, -1.817704],
    [-2.281725, -1.977639, -1.817704],
    [-3.008381, -1.741534, -0.581443],
    [ 3.008381, -1.741534, -0.581443],
    [ 2.281725, -1.977639, -1.817704],
    [ 2.585938, -2.322977,  0.581443],
    [ 1.175755, -2.781173, -1.817704],
    [ 0.      , -2.399147, -2.581756],
    [ 2.281725, -0.741377, -2.581756],
    [ 1.175755, -0.382026, -3.300459],
    [ 0.      , -1.236262, -3.300459],
    [ 3.008381, -0.258779,  1.817704],
    [ 3.457479,  0.359351,  0.581443],
    [ 2.585938, -1.558925,  1.817704],
    [ 3.457479, -0.359351, -0.581443],
    [ 3.008381,  0.258779, -1.817704],
    [ 3.008381,  1.741534,  0.581443],
    [ 2.585938,  2.322977, -0.581443],
    [ 2.585938,  1.558925, -1.817704],
    [-0.726656,  1.000157, -3.300459],
    [ 0.726656,  1.000157, -3.300459],
    [ 1.410183,  1.940951, -2.581756],
    [-1.410183,  1.940951, -2.581756],
    [-3.008381,  0.258779, -1.817704],
    [-2.281725, -0.741377, -2.581756],
    [-1.175755, -0.382026, -3.300459],
    [-2.585938,  1.558925, -1.817704],
    [-3.008381,  1.741534,  0.581443],
    [-3.457479,  0.359351,  0.581443],
    [-3.457479, -0.359351, -0.581443],
    [-2.585938,  2.322977, -0.581443],
    [-0.726656,  3.399304,  0.581443],
    [-1.175755,  2.781173,  1.817704],
    [-2.281725,  1.977639,  1.817704],
    [-1.410183,  3.177213, -0.581443],
    [ 0.683527,  2.941108, -1.817704],
    [ 1.410183,  3.177213, -0.581443],
    [ 0.726656,  3.399304,  0.581443],
    [-0.683527,  2.941108, -1.817704]
    ])


viewer = napari.Viewer(ndisplay=3)
points_layer = viewer.add_points(atoms)

points_layer.shading = "spherical"
points_layer.face_color = "teal"
points_layer.border_width = 0
points_layer.size = 0.3

N = len(atoms)

r_cutoff = 1.3 * 1.7 # ~1.3 * C-C bonds length

bonds = []

# Process of creating bonds between atoms
# If the absolute distance between two atoms
# is less than r_cutoff then we append coordinates of the vector
# and its projection in every axis (x, y, z)

for i in range(N):
    for j in range(i + 1, N):
        rij = atoms[j] - atoms[i]
        dist = np.linalg.norm(rij)
        if dist <= r_cutoff:
            bonds.append([atoms[i], rij])

# Finally, we pass N x 2 x D NumPy array to vectors layer
vectors_layer = viewer.add_vectors(np.array(bonds))

vectors_layer.edge_width = 0.1
vectors_layer.vector_style = "line"
vectors_layer.length = 1
vectors_layer.edge_color = "crimson"

viewer.dims.axis_labels = ("x", "y", "z")
viewer.floating_axes.visible = True

if __name__ == '__main__':
    napari.run()