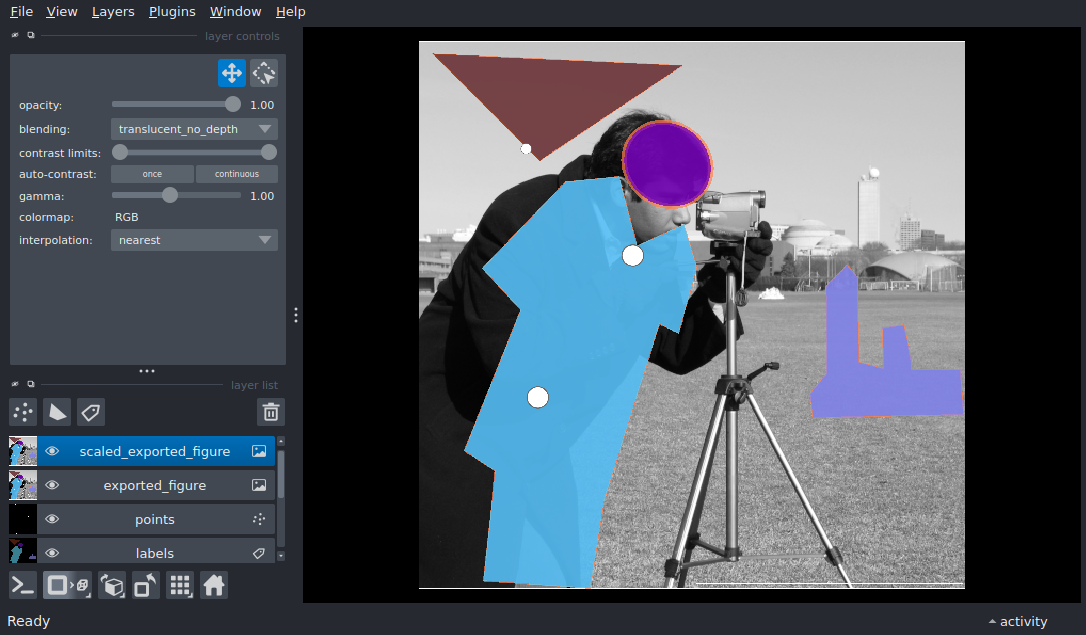
Export Figure#
Display a variety of layer types in the napari viewer and export the figure with viewer.export_figure(). The exported figure is then added back as an image layer.
Exported figures include the extent of all data in 2D or 3D view. To capture the extent of the canvas, instead of the layers, see viewer.screenshot(): To screenshot and Comparison of Screenshot and Figure Export.
/home/runner/work/docs/docs/.venv/lib/python3.12/site-packages/napari/_qt/qt_event_loop.py:49: UserWarning: System theme detection requires a Qt6 backend. Please switch to PyQt6 or PySide6 to use it.
  theme_type=get_system_theme(),
/home/runner/work/docs/docs/.venv/lib/python3.12/site-packages/napari/_qt/qt_event_loop.py:49: UserWarning: System theme detection requires a Qt6 backend. Please switch to PyQt6 or PySide6 to use it.
  theme_type=get_system_theme(),
import numpy as np
from skimage import data

import napari

# create the viewer and window
viewer = napari.Viewer()

# add the image
img_layer = viewer.add_image(data.camera(), name='photographer')
img_layer.colormap = 'gray'

# create a list of polygons
polygons = [
    np.array([[11, 13], [111, 113], [22, 246]]),
    np.array(
        [
            [505, 60],
            [402, 71],
            [383, 42],
            [251, 95],
            [212, 59],
            [131, 137],
            [126, 187],
            [191, 204],
            [171, 248],
            [211, 260],
            [273, 243],
            [264, 225],
            [430, 173],
            [512, 160],
        ]
    ),
    np.array(
        [
            [310, 382],
            [229, 381],
            [209, 401],
            [221, 411],
            [258, 411],
            [300, 412],
            [306, 435],
            [268, 434],
            [265, 454],
            [298, 461],
            [307, 461],
            [307, 507],
            [349, 510],
            [352, 369],
            [330, 366],
            [330, 366],
        ]
    ),
]

# add polygons
layer = viewer.add_shapes(
    polygons,
    shape_type='polygon',
    edge_width=1,
    edge_color='coral',
    face_color='royalblue',
    name='shapes',
)

# add an ellipse to the layer
ellipse = np.array([[59, 222], [110, 289], [170, 243], [119, 176]])
layer.add(
    ellipse,
    shape_type='ellipse',
    edge_width=5,
    edge_color='coral',
    face_color='purple',
)

labels = layer.to_labels([512, 512])
labels_layer = viewer.add_labels(labels, name='labels')

points = np.array([[100, 100], [200, 200], [333, 111]])
size = np.array([10, 20, 20])
viewer.add_points(points, size=size)

# Add scale bar of a defined length to the exported figure
viewer.canvas.overlays.scale_bar.visible = True
viewer.canvas.overlays.scale_bar.length = 250

# Export figure and change theme before and after exporting to show that the background canvas margins
# are not in the exported figure.
viewer.theme = "light"
# Optionally for saving the exported figure: viewer.export_figure(path="export_figure.png")
export_figure = viewer.export_figure()
scaled_export_figure = viewer.export_figure(scale_factor=5)
viewer.theme = "dark"

viewer.add_image(export_figure, rgb=True, name='exported_figure')
viewer.add_image(scaled_export_figure, rgb=True, name='scaled_exported_figure')
viewer.reset_view()

if __name__ == '__main__':
    napari.run()