Layer Bounding Box (Border) Overlay#
Display an image in napari and add a bounding box overlay (a border) at the edges of the layer.
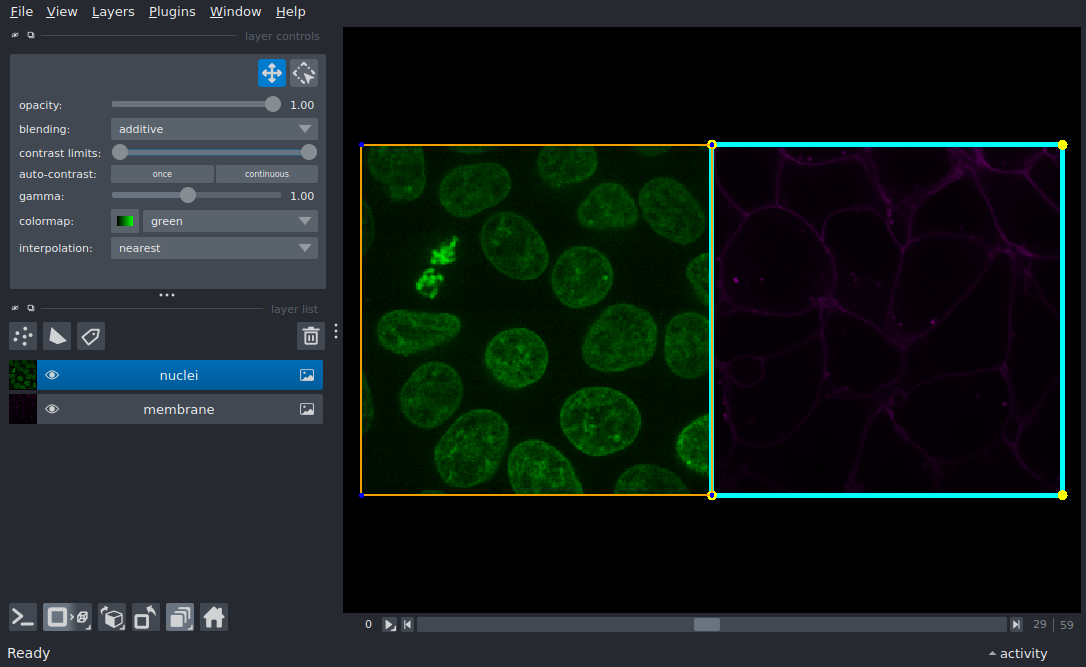
The bounding box overlay is a visual representation of the extents of a layer. This example demonstrates visualization of many bounding box overlay properties, including line color, line thickness, point size, opacity. In addition, this viewer shows how layer overlays interact when draw on top of each other (at the intersection of the grid). Use viewer.layers[0].bounding_box to view all modifiable attributes of the overlay.
For an example showing how bounding box extents are visualized, see 3D Layer Bounding Box Overlay.
/home/runner/work/docs/docs/.venv/lib/python3.12/site-packages/napari/_qt/qt_event_loop.py:49: UserWarning: System theme detection requires a Qt6 backend. Please switch to PyQt6 or PySide6 to use it.
  theme_type=get_system_theme(),
/home/runner/work/docs/docs/.venv/lib/python3.12/site-packages/napari/_qt/qt_event_loop.py:49: UserWarning: System theme detection requires a Qt6 backend. Please switch to PyQt6 or PySide6 to use it.
  theme_type=get_system_theme(),
from skimage import data

import napari

# Create a napari viewer with a 3D, 2 channel image, with the `add_image` convenience function.
viewer = napari.Viewer()
membrane, nuclei = viewer.add_image(data.cells3d(), channel_axis=1, name=['membrane', 'nuclei'])
viewer.canvas.grid.enabled = True

# Add a border overlay to each layer, and modify properties of the border overlay.
viewer.layers[0].bounding_box.visible = True
viewer.layers[0].bounding_box.line_color = 'cyan' # default: 'red'
viewer.layers[0].bounding_box.line_thickness = 5 # default: 1, maximum is GPU-dependent, see: https://vispy.org/api/vispy.scene.visuals.html#vispy.scene.visuals.Line
viewer.layers[0].bounding_box.point_size = 10 # default: 5
viewer.layers[0].bounding_box.point_color = 'yellow' # default: 'blue'

viewer.layers[1].bounding_box.visible = True
viewer.layers[1].bounding_box.line_color = 'orange'
viewer.layers[1].bounding_box.line_thickness = 2
viewer.layers[1].bounding_box.opacity = 0.8 # default: 1
# viewer_2d.layers[1].bounding_box.blending = 'additive' # default: 'translucent'
viewer.fit_to_view()

if __name__ == '__main__':
    napari.run()