Note
Go to the end to download the full example as a Python script or as a Jupyter notebook..
Export regions of interest (ROIs) to png#
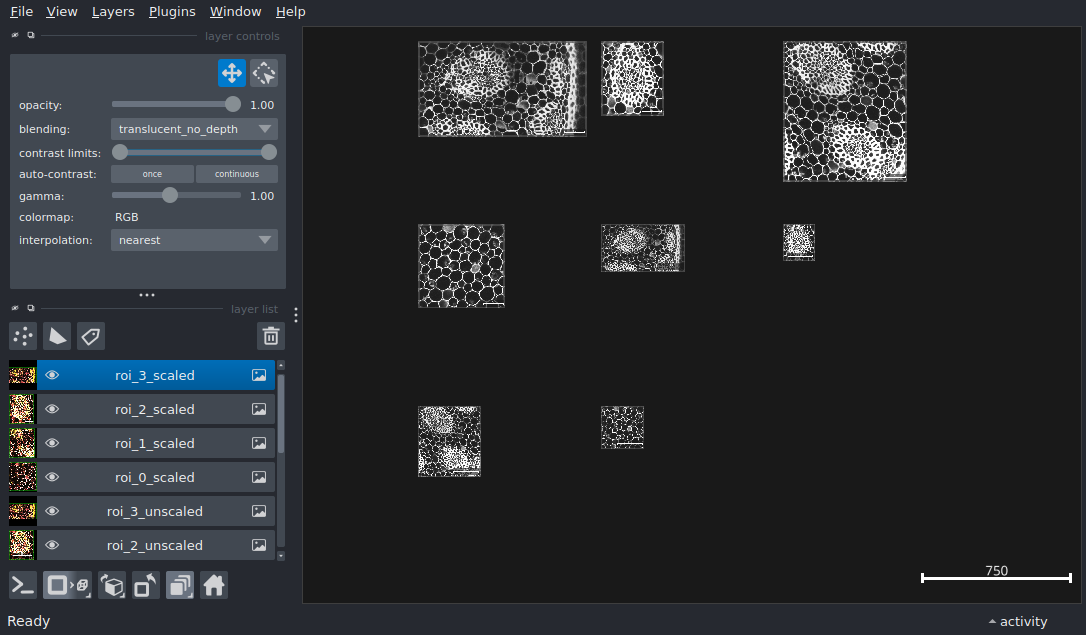
Display multiple layer types one of them representing ROIs, add scale bar, and export unscaled and scaled rois. The scale bar will always be within the screenshot of the ROI.
Currently, export_rois does not support the 3D view or any other shape than 2D rectangles.
In the final grid state shown below, from left to right, top to bottom, the first 4 images display the scaled roi screenshots with scale bar and the last 4 display the unscaled roi screenshots with scale bar.

import numpy as np
from skimage import data

import napari

# Create a napari viewer with multiple layer types and add a scale bar.
# One of the polygon shapes exists outside the image extent, which is
# useful in displaying how figure export handles the extent of all layers.

viewer = napari.Viewer()

# add a 2D image layer
img_layer = viewer.add_image(data.lily(), name='lily', channel_axis=2)

# Rectangular shapes encapsulating rois for the lily data
rois = [np.array([[149.38401138,  61.80004348],
        [149.38401138, 281.95358131],
        [364.2538643 , 281.95358131],
        [364.2538643 ,  61.80004348]]),
 np.array([[316.70070013, 346.23841435],
        [316.70070013, 660.61766637],
        [673.34943141, 660.61766637],
        [673.34943141, 346.23841435]]),
 np.array([[579.12371722,  16.88872176],
        [579.12371722, 176.27988315],
        [768.45575975, 176.27988315],
        [768.45575975,  16.88872176]]),
 np.array([[ 43.42954911, 445.29831816],
        [ 43.42954911, 871.04161258],
        [285.58890617, 871.04161258],
        [285.58890617, 445.29831816]])]

# Add lily rois to the viewer for visualization purposes, not required for exporting roi screenshots.
roi_layer = viewer.add_shapes(
    rois, # in case of a shapes layer containing rectangular rois, pass on layer.data directly.
    edge_width=10,
    edge_color='green', # Optionally, set to [(0, 0, 0, 0)] * 4 to prevent edge color from showing in screenshots.
    face_color=[(0, 0, 0, 0)] * 4, # We do not want the face color to show up in the screenshots
    shape_type='rectangle',
    name='rois',
)

# add scale_bar with background box
viewer.scale_bar.visible = True
viewer.scale_bar.box = True
# viewer.scale_bar.length = 150  # prevent dynamic adjustment of scale bar length

# Take screenshots of the rois.
screenshot_rois = viewer.export_rois(rois)
# Optionally, save the exported rois in a directory of choice with name `roi_n.png` where n is the index of the roi:
# viewer.export_rois(rois, paths='home/data/exported_rois')
# Optionally, save the exported rois while specifying the location for each roi to be stored:
# viewer.export_rois(rois, paths=['first_roi.png', 'second_roi.png', 'third_roi.png', 'fourth_roi.png'])

# Also take scaled roi screenshots.
screenshot_rois_scaled = viewer.export_rois(rois, scale=2
                                     )
viewer.layers.select_all()
viewer.layers.toggle_selected_visibility()
for index, roi in enumerate(screenshot_rois):
    viewer.add_image(roi, name=f'roi_{index}_unscaled')

for index, roi in enumerate(screenshot_rois_scaled):
    viewer.add_image(roi, name=f'roi_{index}_scaled')

viewer.grid.enabled = True
viewer.grid.shape = (3, 3)


if __name__ == '__main__':
    napari.run()