Note
Go to the end to download the full example as a Python script or as a Jupyter notebook..
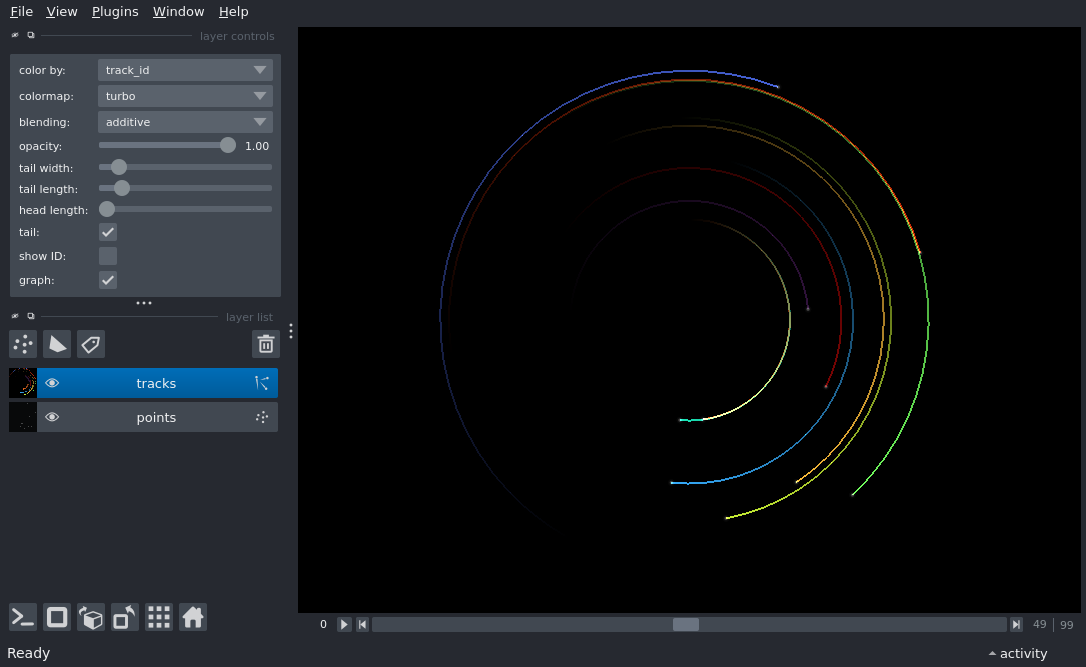
Tracks 2D#

import numpy as np

import napari


def _circle(r, theta):
    x = r * np.cos(theta)
    y = r * np.sin(theta)
    return x, y


def tracks_2d(num_tracks=10):
    """ create 2d+t track data """
    tracks = []

    for track_id in range(num_tracks):

        # space to store the track data and features
        track = np.zeros((100, 6), dtype=np.float32)

        # time
        timestamps = np.arange(track.shape[0])

        radius = 20 + 30 * np.random.random()
        theta = timestamps * 0.1 + np.random.random() * np.pi
        x, y = _circle(radius, theta)

        track[:, 0] = track_id
        track[:, 1] = timestamps
        track[:, 2] = 50.0 + y
        track[:, 3] = 50.0 + x
        track[:, 4] = theta
        track[:, 5] = radius

        tracks.append(track)

    tracks = np.concatenate(tracks, axis=0)
    data = tracks[:, :4]  # just the coordinate data

    features = {
        'time': tracks[:, 1],
        'theta': tracks[:, 4],
        'radius': tracks[:, 5],
    }

    graph = {}
    return data, features, graph


tracks, features, graph = tracks_2d(num_tracks=10)
vertices = tracks[:, 1:]

viewer = napari.Viewer()
viewer.add_points(vertices, size=1, name='points', opacity=0.3)
viewer.add_tracks(tracks, features=features, name='tracks')

if __name__ == '__main__':
    napari.run()