
Displaying xarray data in napari#
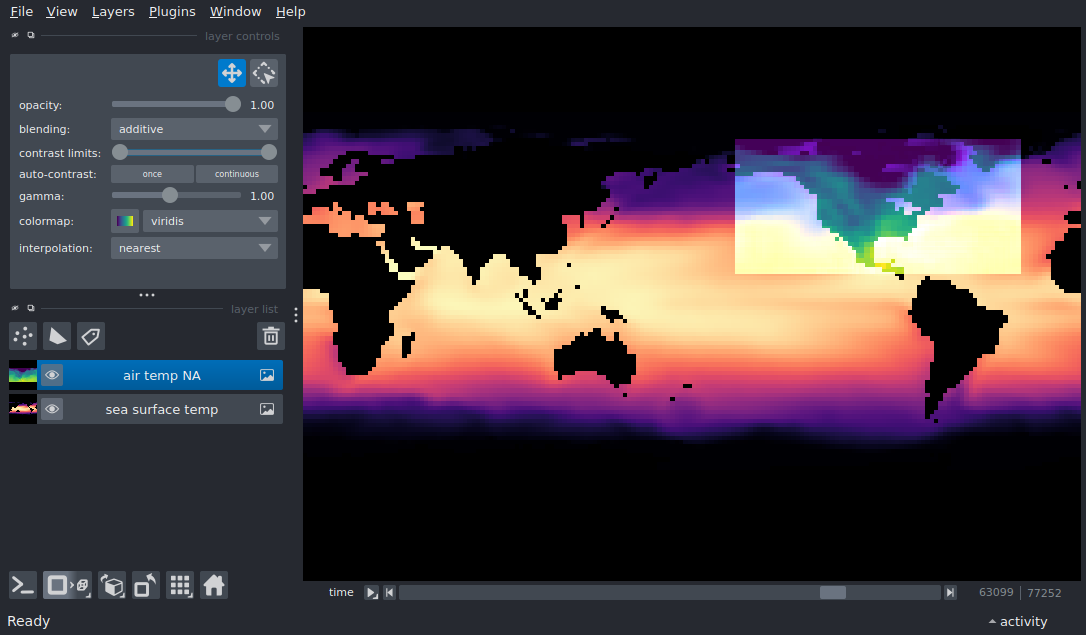
This example shows how to view xarray datasets in napari.
napari automatically inherits axis_labels, scale, and units (if valid Pint units), and translate from xarray DataArrays when available.
Currently, napari cannot display irregularly-sampled data, so the code assumes that the data indices are regularly spaced. If your indices are irregular, use xarray.Dataset.interp to create a regularly-spaced version before displaying it in napari.
Extra packages required
This example requires additional packages that are not available in typical
napari installations.
For this example to work in recommended napari installations,
you will need to install additional packages: xarray.
See the plugin manager guide
for ways to install additional packages from within napari.
import numpy as np
import pint
import xarray as xr

import napari

# The tutorial datasets use CF-compliant unit strings ('degrees_north',
# 'degrees_east') that pint does not know on its own. Register them with
# pint's application registry so napari can recognise the lat/lon units.
ureg = pint.get_application_registry()
ureg.define('degrees_north = degree')
ureg.define('degrees_east = degree')

# open the xarray global sea surface temperature (40MB) and North America
# air temperature (30MB) datasets
sst = xr.tutorial.open_dataset('ersstv5')
airtemp = xr.tutorial.open_dataset('air_temperature')

# Show the raw (not resampled) model data
viewer, sst_layer = napari.imshow(
    sst.sst,
    name='sea surface temp',
    colormap='magma',
)

air_layer = viewer.add_image(
    airtemp.air,
    name='air temp NA',
    colormap='viridis',
    blending='additive',
    contrast_limits=(-23 + 273, 32 + 273),  # data are in degrees Kelvin
)


# set a time point that overlaps both datasets. The time axis inherits a
# real time unit (hours/days since 1970-01-01); napari reconciles the two
# layers' different units, so we navigate it in hours.
time_point = np.datetime64('2013-09-23').astype('datetime64[h]').astype(float)
viewer.dims.set_point(0, time_point)

# latitude goes from -90 (south, down) to 90 (north, up),
# so we make sure that the camera vertical axis points up.
viewer.scene.camera.orientation2d = ('up', 'right')
viewer.canvas.overlays.scale_bar.visible = True

# fill the frame
viewer.fit_to_view()


if __name__ == '__main__':
    napari.run()