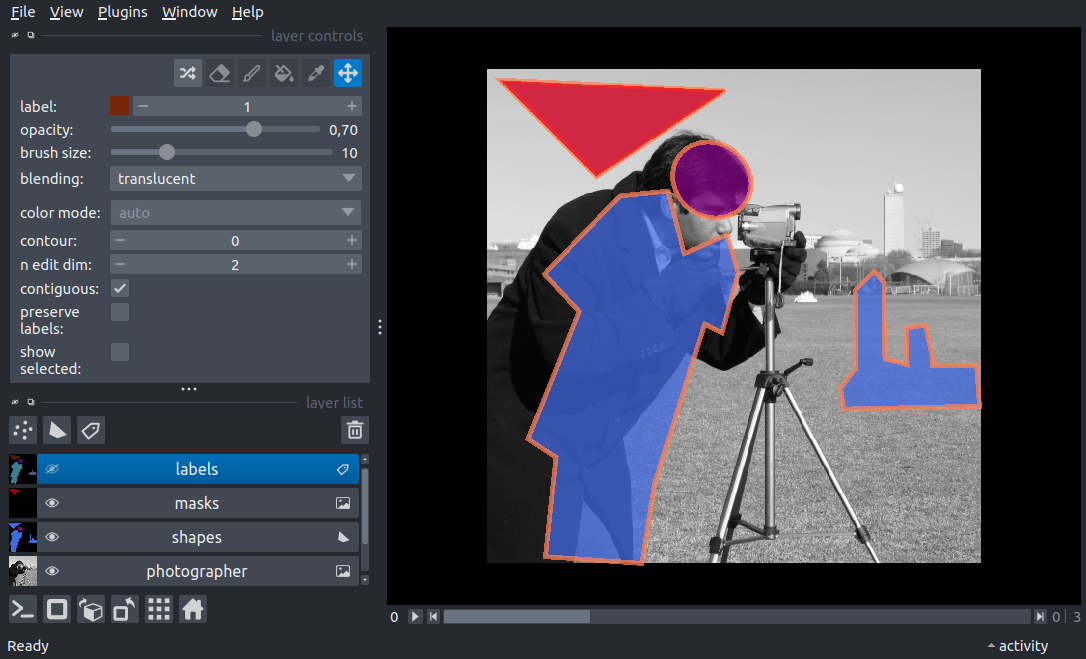
Shapes to labels#
Display one shapes layer ontop of one image layer using the add_shapes and
add_image APIs. When the window is closed it will print the coordinates of
your shapes.
/home/runner/work/docs/docs/.venv/lib/python3.12/site-packages/napari/_qt/qt_event_loop.py:50: UserWarning: System theme detection requires a Qt6 backend. Please switch to PyQt6 or PySide6 to use it.
  theme_type=get_system_theme(),
import numpy as np
from skimage import data
from vispy.color import Colormap

import napari

# create the viewer and window
viewer = napari.Viewer()

# add the image
img_layer = viewer.add_image(data.camera(), name='photographer')

# create a list of polygons
polygons = [
    np.array([[11, 13], [111, 113], [22, 246]]),
    np.array(
        [
            [505, 60],
            [402, 71],
            [383, 42],
            [251, 95],
            [212, 59],
            [131, 137],
            [126, 187],
            [191, 204],
            [171, 248],
            [211, 260],
            [273, 243],
            [264, 225],
            [430, 173],
            [512, 160],
        ]
    ),
    np.array(
        [
            [310, 382],
            [229, 381],
            [209, 401],
            [221, 411],
            [258, 411],
            [300, 412],
            [306, 435],
            [268, 434],
            [265, 454],
            [298, 461],
            [307, 461],
            [307, 507],
            [349, 510],
            [352, 369],
            [330, 366],
            [330, 366],
        ]
    ),
]

# add polygons
layer = viewer.add_shapes(
    polygons,
    shape_type='polygon',
    edge_width=1,
    edge_color='coral',
    face_color='royalblue',
    name='shapes',
)

# change some attributes of the layer
layer.selected_data = set(range(layer.nshapes))
layer.current_edge_width = 5
layer.opacity = 0.75
layer.selected_data = set()

# add an ellipse to the layer
ellipse = np.array([[59, 222], [110, 289], [170, 243], [119, 176]])
layer.add(
    ellipse,
    shape_type='ellipse',
    edge_width=5,
    edge_color='coral',
    face_color='purple',
)

masks = layer.to_masks([512, 512])
masks_layer = viewer.add_image(masks.astype(float), name='masks')
masks_layer.opacity = 0.7
masks_layer.colormap = Colormap([[0.0, 0.0, 0.0, 0.0], [1.0, 0.0, 0.0, 1.0]])

labels = layer.to_labels([512, 512])
labels_layer = viewer.add_labels(labels, name='labels')
labels_layer.visible = False

if __name__ == '__main__':
    napari.run()