Image#
In this document, you will learn how to use the napari image layer,
including the types of images that can be displayed, and how to set properties
like contrast limits, opacity, colormaps, blending and interpolation.
You will also understand how to add and manipulate a variety of different types
of images both from the GUI and from the console.
For more information about layers, refer to Layers at a glance.
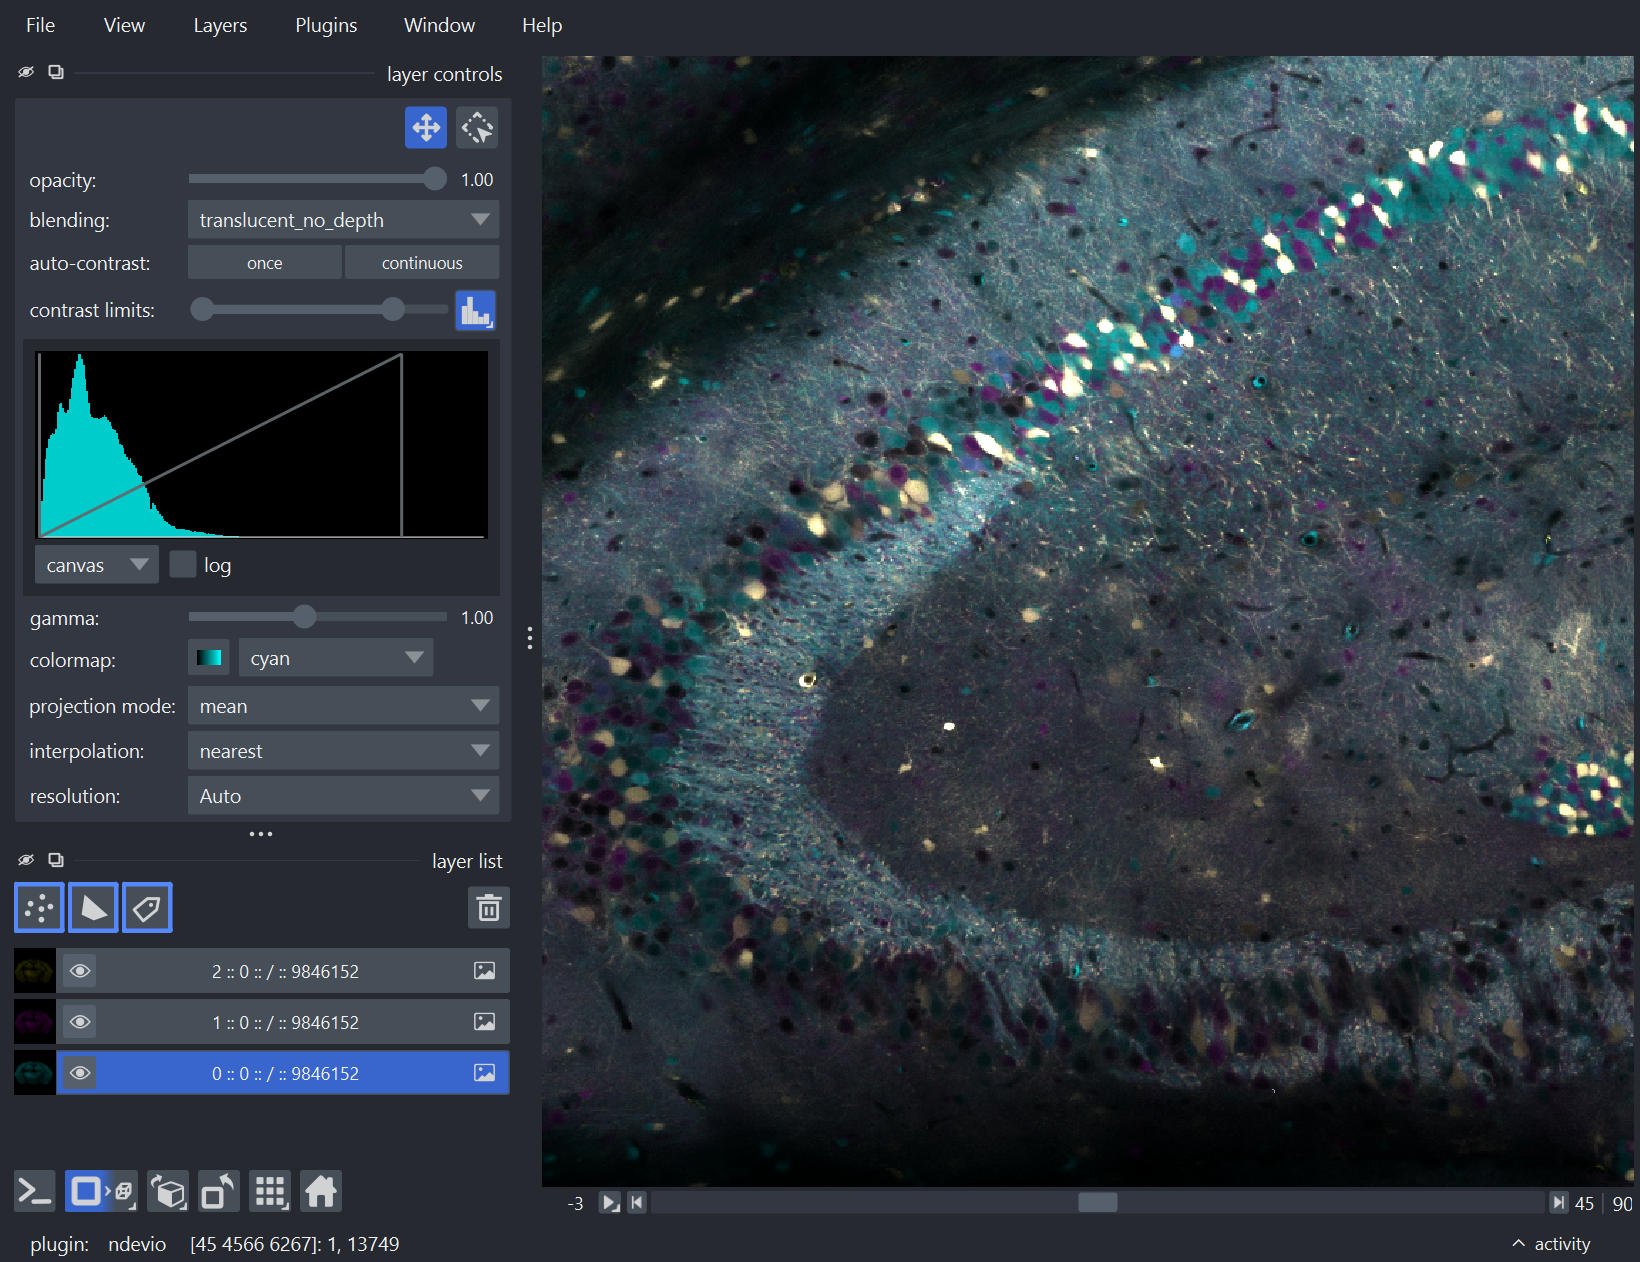
Controlling the image layer using the GUI#
The GUI contains following tools in the layer controls panel for the image
layer:
Buttons
Pan/zoom
Transform
Controls
Opacity
Contrast Limits
Auto-contrast
Histogram
Gamma
Colormap
Blending
Interpolation
Before we can use any of the GUI layer controls, we must load an image.
Start napari.
Click
File>Open Sample>napari builtins>Cells (3D+2Ch)or any sample image of your choice.
Buttons#
Pan/zoom is the default mode
of the layer and supports panning and zooming. Press the
is the default mode
of the layer and supports panning and zooming. Press the 1key when the layer is selected to use this mode.Transform enables you to
rotate, scale, or translate the layer. Note: at present this feature is limited to 2D viewer display mode.
To reset the transformation,
you can Option/Alt-click the transform button (a confirmation dialog will open to
confirm the reset). Press the
enables you to
rotate, scale, or translate the layer. Note: at present this feature is limited to 2D viewer display mode.
To reset the transformation,
you can Option/Alt-click the transform button (a confirmation dialog will open to
confirm the reset). Press the 2key when the layer is selected to use this mode.
Controls#
The GUI controls may be adjusted as follows:
opacityis adjusted by moving the circle along the slider until the image has the opacity you want. 0 is transparent and 1 is completely opaque.contrast limitsare adjusted by moving the minimum and maximum circles along the slider until you have the contrast limits you want. For more precise control, including the ability to set specific numerical values, you can right-click on the slider. Note: Contrast limits are explained in Adjusting contrast limits.auto-contrastis adjusted by selecting eitheronceorcontinuous.onceadjusts the contrast one time whilecontinuousadjusts the contrast as you explore the image.histogramshows the distribution of pixel values for the layer. The histogram button sits next to the contrast limits slider.Left-click the button to toggle the histogram inline in the layer controls.
Right-click to open an advanced popup with the histogram, a larger contrast limits slider, gamma correction, and reset buttons. See the Histogram for a detailed explanation of canvas and full modes, log scale, and how it handles large data.
gammacan be adjusted from a minimum of 0.20 to a maximum of 2.00. Gamma correction or gamma is a nonlinear operation used to encode and decode luminance or tristimulus values.colormapis selected from the dropdown. Note: If the image you select is an RGB or RGBA image, the colormap is automatically assigned RGB and cannot be changed. You can find out if your image is RGB or RGBA by looking at the.rgbproperty of the image layer.blendinghas the options oftranslucent,translucent no depth,additive,minimum, oropaquein the dropdown. Refer to the Blending layers section of Layers at a glance for an explanation of each type of blending.interpolationmay be assigned one of the following from the dropdown:cubiclinearkaisernearest- defaultspline36
Note: There is a brief explation of interpolation in Layers at a glance.
Controlling the image layer from the console#
A simple example#
Create a new viewer and add an image in one go using the napari.imshow()
function, or if you already have an existing viewer, add an image to it using
viewer.add_image. The API for both methods is the same. In these examples
we’ll mainly use imshow.
A simple example of viewing an image is as follows:
import napari
from skimage import data

cells = data.cells3d()[30, 1]  # grab some data
viewer, _ = napari.imshow(cells, colormap='magma')
/home/runner/work/docs/docs/.venv/lib/python3.12/site-packages/napari/_qt/qt_event_loop.py:50: UserWarning: System theme detection requires a Qt6 backend. Please switch to PyQt6 or PySide6 to use it.
  theme_type=get_system_theme(),
/home/runner/work/docs/docs/.venv/lib/python3.12/site-packages/napari/_qt/qt_event_loop.py:50: UserWarning: System theme detection requires a Qt6 backend. Please switch to PyQt6 or PySide6 to use it.
  theme_type=get_system_theme(),
WARNING: napari support for the PyQt5 backend is deprecated and will be removed in fall of 2026
/home/runner/work/docs/docs/.venv/lib/python3.12/site-packages/napari/_qt/qt_event_loop.py:50: UserWarning: System theme detection requires a Qt6 backend. Please switch to PyQt6 or PySide6 to use it.
  theme_type=get_system_theme(),

Arguments of imshow and add_image#
napari.imshow() and add_image()
accept the same layer-creation parameters.
help(napari.imshow)
Image data and NumPy-like arrays#
napari can take any NumPy-like array as input for its image layer. A NumPy-like
array can be a
numpy array,
a dask array, an
xarray, a
zarr array, or any other
object that you can index into and when you call
np.asarray
on it you get back a NumPy array.
The great thing about napari support of array-like objects is that you get to keep on using your favorite array libraries without worrying about any conversions. napari handles all of that for you.
napari will also wait until just before it displays data onto the screen to
actually generate a NumPy array from your data, and so if you’re using a library
like dask or zarr that supports lazy loading and lazy evaluation, we won’t
force you to load or compute data that you’re not examining. This enables
napari to seamlessly browse enormous datasets that are loaded in the right way.
For example, here we are browsing over 100GB of lattice lightsheet data stored
in a zarr file:
Multiscale images#
For exceptionally large datasets, napari supports multiscale images (sometimes called image pyramids). A multiscale image is a list of arrays, where each array is downsampling of the previous array in the list. This means you end up with images of successively smaller and smaller shapes. A standard multiscale image might have a 2x downsampling at each level, but napari can support any type of multiscale image as long as the shapes are getting smaller each time.
Multiscale images are especially useful for incredibly large 2D images when viewed in 2D or incredibly large 3D images when viewed in 3D. For example this ~100k x 200k pixel pathology image consists of 10 pyramid levels and can be easily browsed as at each moment in time we only load the level of the multiscale image and the part of the image that needs to be displayed:
This example had precomputed multiscale images stored in a zarr file, which is
best for performance. If you don’t have a precomputed multiscale image but try
and show an exceptionally large image, napari will try and compute the
best for performance.
You can use the boolean multiscale keyword argument when creating an image
layer to specify if your data is a multiscale image or not. If you don’t provide
this value, then napari will try and guess whether your data is or needs to be a
multiscale image.
Locking the multiscale level#
By default, napari automatically selects which resolution level to display based on the current zoom and viewport. In 2D this means zooming in loads higher-resolution data, while in 3D the coarsest level is used for performance.
If you want to force a specific resolution level — for example, to keep a
consistent view while panning or to inspect a particular level — you can set
the locked_data_level property, or using the resolution dropdown in the layer controls:
# Lock rendering to level 0 (highest resolution)
layer.locked_data_level = 0

# Restore automatic level selection
layer.locked_data_level = None
When a level is locked, napari loads the full extent of that level on the currently
displayed dimensions regardless of zoom or display mode. The lock is automatically
reset to None when the layer’s data is replaced.
This property is available on both Image and Labels layers.
Loading multichannel images#
Each channel in a multichannel image can be displayed as an individual layer by
using the channel_axis argument in viewer.add_image(). All the rest of
the arguments to viewer.add_image() (e.g. name, colormap,
contrast_limit) can take the form of a list of the same size as the number of
channels.
For example, the multichannel image below has dimensions (60, 2, 256, 256) with axes ordered ZCYX (so the channel axis has an index of 1). It is loaded into napari in one line, as shown below:
import napari
from skimage import data

cells = data.cells3d() #ZCYX image data

# load multichannel image in one line
viewer, layers = napari.imshow(cells, channel_axis=1)

# load multichannel image in one line, with additional options
viewer, layers = napari.imshow(
    cells,
    channel_axis=1,
    name=["membrane", "nuclei"],
    colormap=["green", "magenta"],
    contrast_limits=[[1000, 20000], [1000, 50000]],
)
/home/runner/work/docs/docs/.venv/lib/python3.12/site-packages/napari/_qt/qt_event_loop.py:50: UserWarning: System theme detection requires a Qt6 backend. Please switch to PyQt6 or PySide6 to use it.
  theme_type=get_system_theme(),
/home/runner/work/docs/docs/.venv/lib/python3.12/site-packages/napari/_qt/qt_event_loop.py:50: UserWarning: System theme detection requires a Qt6 backend. Please switch to PyQt6 or PySide6 to use it.
  theme_type=get_system_theme(),
/home/runner/work/docs/docs/.venv/lib/python3.12/site-packages/napari/_qt/qt_event_loop.py:50: UserWarning: System theme detection requires a Qt6 backend. Please switch to PyQt6 or PySide6 to use it.
  theme_type=get_system_theme(),
/home/runner/work/docs/docs/.venv/lib/python3.12/site-packages/napari/_qt/qt_event_loop.py:50: UserWarning: System theme detection requires a Qt6 backend. Please switch to PyQt6 or PySide6 to use it.
  theme_type=get_system_theme(),
/home/runner/work/docs/docs/.venv/lib/python3.12/site-packages/napari/_qt/qt_event_loop.py:50: UserWarning: System theme detection requires a Qt6 backend. Please switch to PyQt6 or PySide6 to use it.
  theme_type=get_system_theme(),

Viewing RGB vs luminance (grayscale) images#
In this example, the rgb keyword is explicitly set to True because we know
we are working with an rgb image:
viewer, layer = napari.imshow(data.astronaut(), rgb=True)
/home/runner/work/docs/docs/.venv/lib/python3.12/site-packages/napari/_qt/qt_event_loop.py:50: UserWarning: System theme detection requires a Qt6 backend. Please switch to PyQt6 or PySide6 to use it.
  theme_type=get_system_theme(),
/home/runner/work/docs/docs/.venv/lib/python3.12/site-packages/napari/_qt/qt_event_loop.py:50: UserWarning: System theme detection requires a Qt6 backend. Please switch to PyQt6 or PySide6 to use it.
  theme_type=get_system_theme(),
/home/runner/work/docs/docs/.venv/lib/python3.12/site-packages/napari/_qt/qt_event_loop.py:50: UserWarning: System theme detection requires a Qt6 backend. Please switch to PyQt6 or PySide6 to use it.
  theme_type=get_system_theme(),

If we had left the rgb keyword argument out, napari would have successfully
guessed that we were trying to show an rgb or rgba image because the final
dimension for the image array was 3 or 4. If you have a luminance image where
the last dimension is 3 or 4, you can set the rgb argument to False to
explicitly state this is not a color image and get a slider for that dimension.
rgb data must either be uint8, corresponding to values between 0 and 255, or
float and between 0 and 1. If the values are float and outside the 0 to 1
range they will be clipped.
Working with colormaps#
napari supports any colormap that is created with vispy.color.Colormap. We
provide access to some standard colormaps that you can set using a string of
their name. These include:
list(napari.utils.colormaps.AVAILABLE_COLORMAPS)
['blue',
 'bop blue',
 'bop orange',
 'bop purple',
 'cyan',
 'fire',
 'gist_earth',
 'gray',
 'gray_r',
 'green',
 'HiLo',
 'hsv',
 'I Blue',
 'I Bordeaux',
 'I Forest',
 'I Orange',
 'I Purple',
 'ice',
 'inferno',
 'magenta',
 'magma',
 'nan',
 'PiYG',
 'plasma',
 'red',
 'turbo',
 'twilight',
 'twilight_shifted',
 'viridis',
 'yellow']
Pass any of these strings to set the image colormap as shown below:
viewer, layer = napari.imshow(data.moon(), colormap='red')
/home/runner/work/docs/docs/.venv/lib/python3.12/site-packages/napari/_qt/qt_event_loop.py:50: UserWarning: System theme detection requires a Qt6 backend. Please switch to PyQt6 or PySide6 to use it.
  theme_type=get_system_theme(),
/home/runner/work/docs/docs/.venv/lib/python3.12/site-packages/napari/_qt/qt_event_loop.py:50: UserWarning: System theme detection requires a Qt6 backend. Please switch to PyQt6 or PySide6 to use it.
  theme_type=get_system_theme(),
You can also access the current colormap through the layer.colormap property
which returns a tuple of the colormap name followed by the vispy colormap
object. You can list all the available colormaps using layer.colormaps.
It is also possible to create your own colormaps using vispy’s
vispy.color.Colormap object. See its
full documentation.
Briefly, you can pass Colormap a list of length 3 or 4, corresponding to the
rgb or rgba values at different points along the colormap.
For example, to make a diverging colormap that goes from red to blue through black, and color a random array, you can use this example code:
import napari
from skimage.data import cell
from vispy.color import Colormap

cmap = Colormap([[1, 0, 0], [0, 0, 0], [0, 0, 1]])
image = cell()

viewer, layer = napari.imshow(image, colormap=('diverging', cmap))
/home/runner/work/docs/docs/.venv/lib/python3.12/site-packages/napari/_qt/qt_event_loop.py:50: UserWarning: System theme detection requires a Qt6 backend. Please switch to PyQt6 or PySide6 to use it.
  theme_type=get_system_theme(),
/home/runner/work/docs/docs/.venv/lib/python3.12/site-packages/napari/_qt/qt_event_loop.py:50: UserWarning: System theme detection requires a Qt6 backend. Please switch to PyQt6 or PySide6 to use it.
  theme_type=get_system_theme(),
/home/runner/work/docs/docs/.venv/lib/python3.12/site-packages/napari/_qt/qt_event_loop.py:50: UserWarning: System theme detection requires a Qt6 backend. Please switch to PyQt6 or PySide6 to use it.
  theme_type=get_system_theme(),

Note in this example the colormap keyword argument was passed as a tuple containing both a name for the new custom colormap and the colormap itself. If we had passed only the colormap it would have been given a default name.
The named colormap now appears in the dropdown alongside a thumbnail of the full range of the colormap.
Adjusting contrast limits#
Each image layer gets mapped through its colormap according to values called
contrast limits. Contrast limits are the minimum and maximum values displayed
by the layer, represented in napari by a 2-tuple where the second value is
larger than the first. The smaller contrast limit corresponds to the value of
the image data that will get mapped to the color defined by 0 in the colormap,
meaning that in most cases any value under the lower contrast limit will appear as black. On
the other hand, the upper contrast limit corresponds to the value of the image
data that will get mapped to the color defined by 1 in the colormap; for an image using the gray colormap, all values larger than this value will appear as white. Note that the values set in the contrast limits do not change the underlying values of the image, only the visualization of the colormap.
For example, if you are looking at an image that has values between 0 and 100 with
a standard gray colormap, and you set the contrast limits to (20, 75), then
all the pixels with values less than 20 will get mapped to black, the color
corresponding to 0 in the colormap, and all pixels with values greater than 75
will get mapped to white, the color corresponding to 1 in the colormap. All
other pixel values between 20 and 75 will get linearly mapped onto the range of
colors between black and white.
In napari you can set the contrast limits when creating an Image layer or on
an existing layer using the contrast_limits keyword argument or property,
respectively.
viewer, layer = napari.imshow(data.moon(), name='moon')
viewer.layers['moon'].contrast_limits=(100, 175)
/home/runner/work/docs/docs/.venv/lib/python3.12/site-packages/napari/_qt/qt_event_loop.py:50: UserWarning: System theme detection requires a Qt6 backend. Please switch to PyQt6 or PySide6 to use it.
  theme_type=get_system_theme(),
/home/runner/work/docs/docs/.venv/lib/python3.12/site-packages/napari/_qt/qt_event_loop.py:50: UserWarning: System theme detection requires a Qt6 backend. Please switch to PyQt6 or PySide6 to use it.
  theme_type=get_system_theme(),
/home/runner/work/docs/docs/.venv/lib/python3.12/site-packages/napari/_qt/qt_event_loop.py:50: UserWarning: System theme detection requires a Qt6 backend. Please switch to PyQt6 or PySide6 to use it.
  theme_type=get_system_theme(),

Because the contrast limits are defined by two values, the corresponding slider has two handles: one adjusts the smaller value, and one adjusts the larger value.
For RGB images, adjusting the contrast limits adjusts the black point and white point of the image.
Important
If you pass contrast_limits as a keyword argument to a layer, then the full
extent of the contrast limits: range slider will also be set to those values!
Tip
If contrast limits are not passed, napari will compute them. If your data is small, napari will take the minimum and maximum values across your entire image. If your data is exceptionally large, this operation can be very time consuming. If you pass an image pyramid, then napari will use only the top level of that pyramid, or it will use the minimum and maximum values across the top, middle, and bottom slices of your image. In general, if working with big images, it is recommended to explicitly set the contrast limits if you can.
For more precise control, you can right-click on the contrast limits slider to show a version of the slider with numerical values. Importantly, all four displayed values can be edited by clicking on them. Editing the numbers above the circular slider handles allows you to precisely specify values for the two contrast limits. Press the Enter or Return to confirm the new value.
Meanwhile, the numbers at the two ends of the horizontal rule let you change the range of the contrast limits slider (programmatically accessed using the contrast_limits_range property). Clicking the full range button will reset the contrast limits slider range back to the full range of the data type (e.g. 0 and 255 for uint8). Finally, clicking the reset button will reset both the contrast limits and the contrast limits range to the full range for uint8 images (0, 255), and to the minimum and maximum of the data for other data types.
Resetting the contrast limits#
When all the image data values are near the bottom of the range, the image can appear black even if there are some very dark (but not quite black) pixels there.
To avoid such issues, you can reset the contrast limits by clicking the “auto-contrast: once” button, or, if that fails, right-clicking on the contrast limits to do manual adjustment, including directly editing the numbers shown or resetting the contrast limits by right-clicking on the slider and clicking the “reset” button in the advanced contrast limits widget.
When in doubt, you can hover over the canvas with your image layer selected, and check the status message as you move the mouse around. That will give you an idea of the range and variability of the data in your layer, helping you set meaningful contrast limits.
Saving without image compression#
When saving an image layer, lossless zlib compression is applied by default. To save with a different level of compression, consider using imageio.imwrite. Adjusting compression can be accomplished by including the appropriate kwargs as outlined in the following locations for tiff or png files.