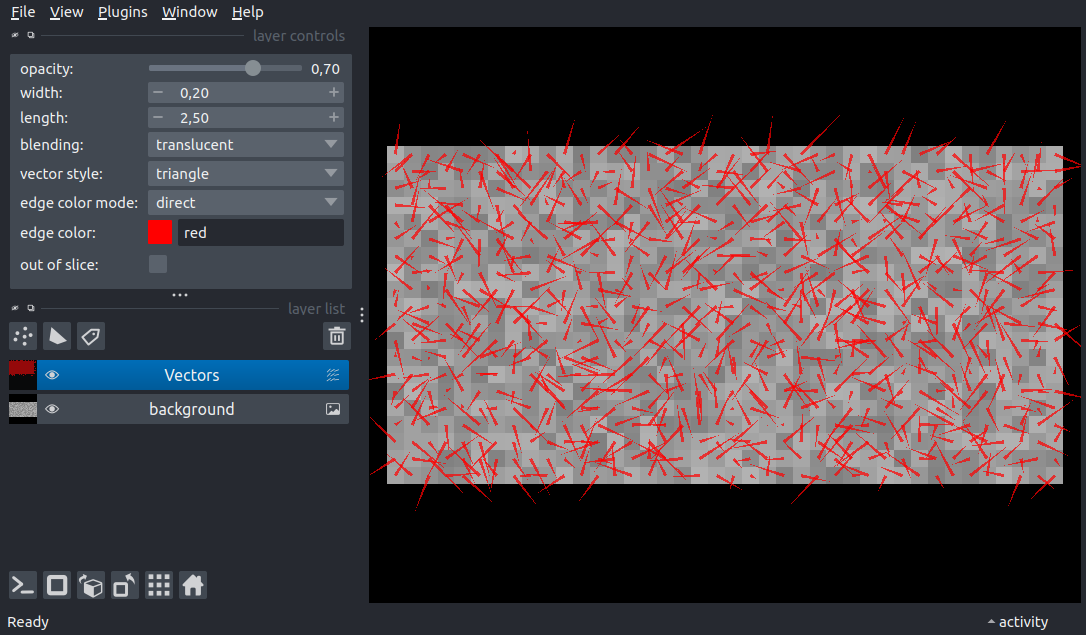
Add vectors image#
This example generates an image of vectors Vector data is an array of shape (N, M, 2) Each vector position is defined by an (x-proj, y-proj) element where * x-proj and y-proj are the vector projections at each center * each vector is centered on a pixel of the NxM grid
/home/runner/work/docs/docs/.venv/lib/python3.12/site-packages/napari/_qt/qt_event_loop.py:50: UserWarning: System theme detection requires a Qt6 backend. Please switch to PyQt6 or PySide6 to use it.
  theme_type=get_system_theme(),
/home/runner/work/docs/docs/.venv/lib/python3.12/site-packages/napari/_qt/qt_event_loop.py:50: UserWarning: System theme detection requires a Qt6 backend. Please switch to PyQt6 or PySide6 to use it.
  theme_type=get_system_theme(),
(20, 40) (20, 40, 2)
import numpy as np

import napari

# create the viewer and window
viewer = napari.Viewer()

n = 20
m = 40

image = 0.2 * np.random.random((n, m)) + 0.5
layer = viewer.add_image(image, contrast_limits=[0, 1], name='background')

# sample vector image-like data
# n x m grid of slanted lines
# random data on the open interval (-1, 1)
pos = np.zeros(shape=(n, m, 2), dtype=np.float32)
rand1 = 2 * (np.random.random_sample(n * m) - 0.5)
rand2 = 2 * (np.random.random_sample(n * m) - 0.5)

# assign projections for each vector
pos[:, :, 0] = rand1.reshape((n, m))
pos[:, :, 1] = rand2.reshape((n, m))

# add the vectors
vect = viewer.add_vectors(pos, edge_width=0.2, length=2.5)

print(image.shape, pos.shape)

if __name__ == '__main__':
    napari.run()