Note
Go to the end to download the full example code
Dynamic projections dask
Using dask array operations, one can dynamically take arbitrary slices and computations of a source dask array and display the results in napari. When the computation takes one or more parameters, one can tie a UI to them using magicgui.
import dask.array as da
import numpy as np
from dask.array.lib.stride_tricks import sliding_window_view
from skimage import data

import napari
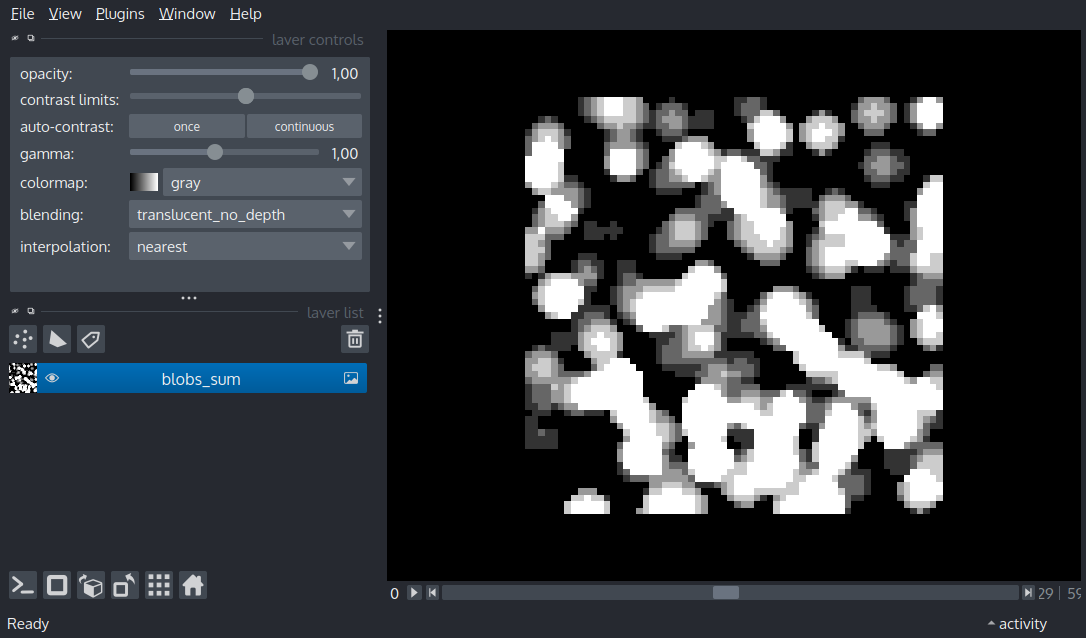
Part 1: using code to view a specific value.
blobs = data.binary_blobs(length=64, n_dim=3)
blobs_dask = da.from_array(blobs, chunks=(1, 64, 64))

# original shape [60, 1, 1, 5, 64, 64],
# use squeeze to remove singleton axes
blobs_dask_windows = np.squeeze(
    sliding_window_view(blobs_dask, window_shape=(5, 64, 64)),
    axis=(1, 2),
)
blobs_sum = np.sum(blobs_dask_windows, axis=1)
viewer = napari.view_image(blobs_sum)

if __name__ == '__main__':
    napari.run()

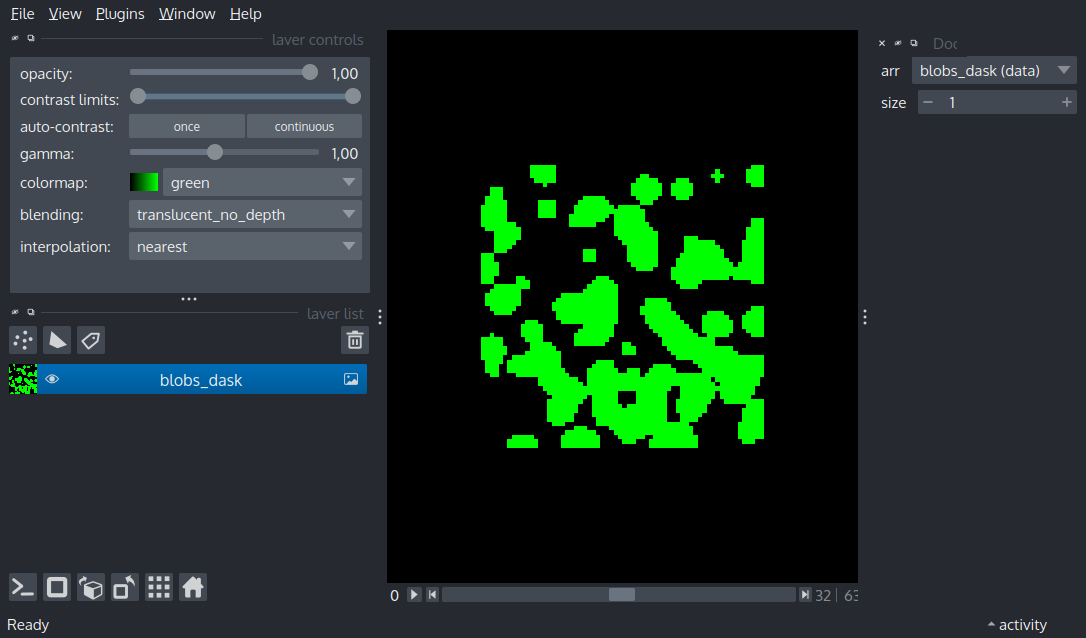
Part 2: using magicgui to vary the slice thickness.
from magicgui import magicgui  # noqa: E402


def sliding_window_mean(
    arr: napari.types.ImageData, size: int = 1
) -> napari.types.LayerDataTuple:
    window_shape = (size,) + (arr.shape[1:])
    arr_windows = sliding_window_view(arr, window_shape=window_shape)
    # as before, use squeeze to remove singleton axes
    arr_windows_1d = np.squeeze(
        arr_windows, axis=tuple(range(1, arr.ndim))
    )
    arr_summed = np.sum(arr_windows_1d, axis=1) / size
    return (
        arr_summed,
        {
            'translate': (size // 2,) + (0,) * (arr.ndim - 1),
            'name': 'mean-window',
            'colormap': 'magenta',
            'blending': 'additive',
        },
        'image',
    )


viewer = napari.view_image(blobs_dask, colormap='green')
viewer.window.add_dock_widget(magicgui(sliding_window_mean, auto_call=True))
viewer.dims.current_step = (32, 0, 0)

if __name__ == '__main__':
    napari.run()
