Debugging during plugin development#
When developing plugins in napari, you may encounter mistakes or bugs in your code. This page covers some ways to debug napari plugins during development, including:
Debugging plugin start-up issues.
Seeing plugin errors and warnings.
Debugging plugin functionality.
Reloading code during plugin development.
Isolating issues from napari.
Logging and debug messages.
Debugging segfaults/memory violation errors
Quick start#
To quickly get started with debugging your plugin, you can do the following:
Install your plugin in editable mode in your virtual environment. For example, you could do this by running
pip install -e .in the root directory of your plugin’s repository.Write a Python script to launch napari with your plugin loaded, like so:
# launch_napari.py
from napari import Viewer, run

viewer = Viewer()
dock_widget, plugin_widget = viewer.window.add_plugin_dock_widget(
    "YOUR_PLUGIN_NAME", "YOUR_WIDGET_NAME"
)
# Optional steps to setup your plugin to a state of failure
# E.g. plugin_widget.parameter_name.value = "some value"
# E.g. plugin_widget.button.click()
run()
Setup the pdb or the debugger in your IDE (such as VSCode or PyCharm) to run this script in debug mode with any desired breakpoints set. For example, in VSCode, you can set a breakpoint by clicking on the line number in the script.
Run the created napari launch script in debug mode. For example, in VSCode, you can do this by opening the script in the editor, selecting your napari virtual environment as the python interpreter and then clicking the
Run and Debugbutton in the left hand toolbar, selectingPython: Fileas the run configuration.At a breakpoint or exception (in VSCode, tick the
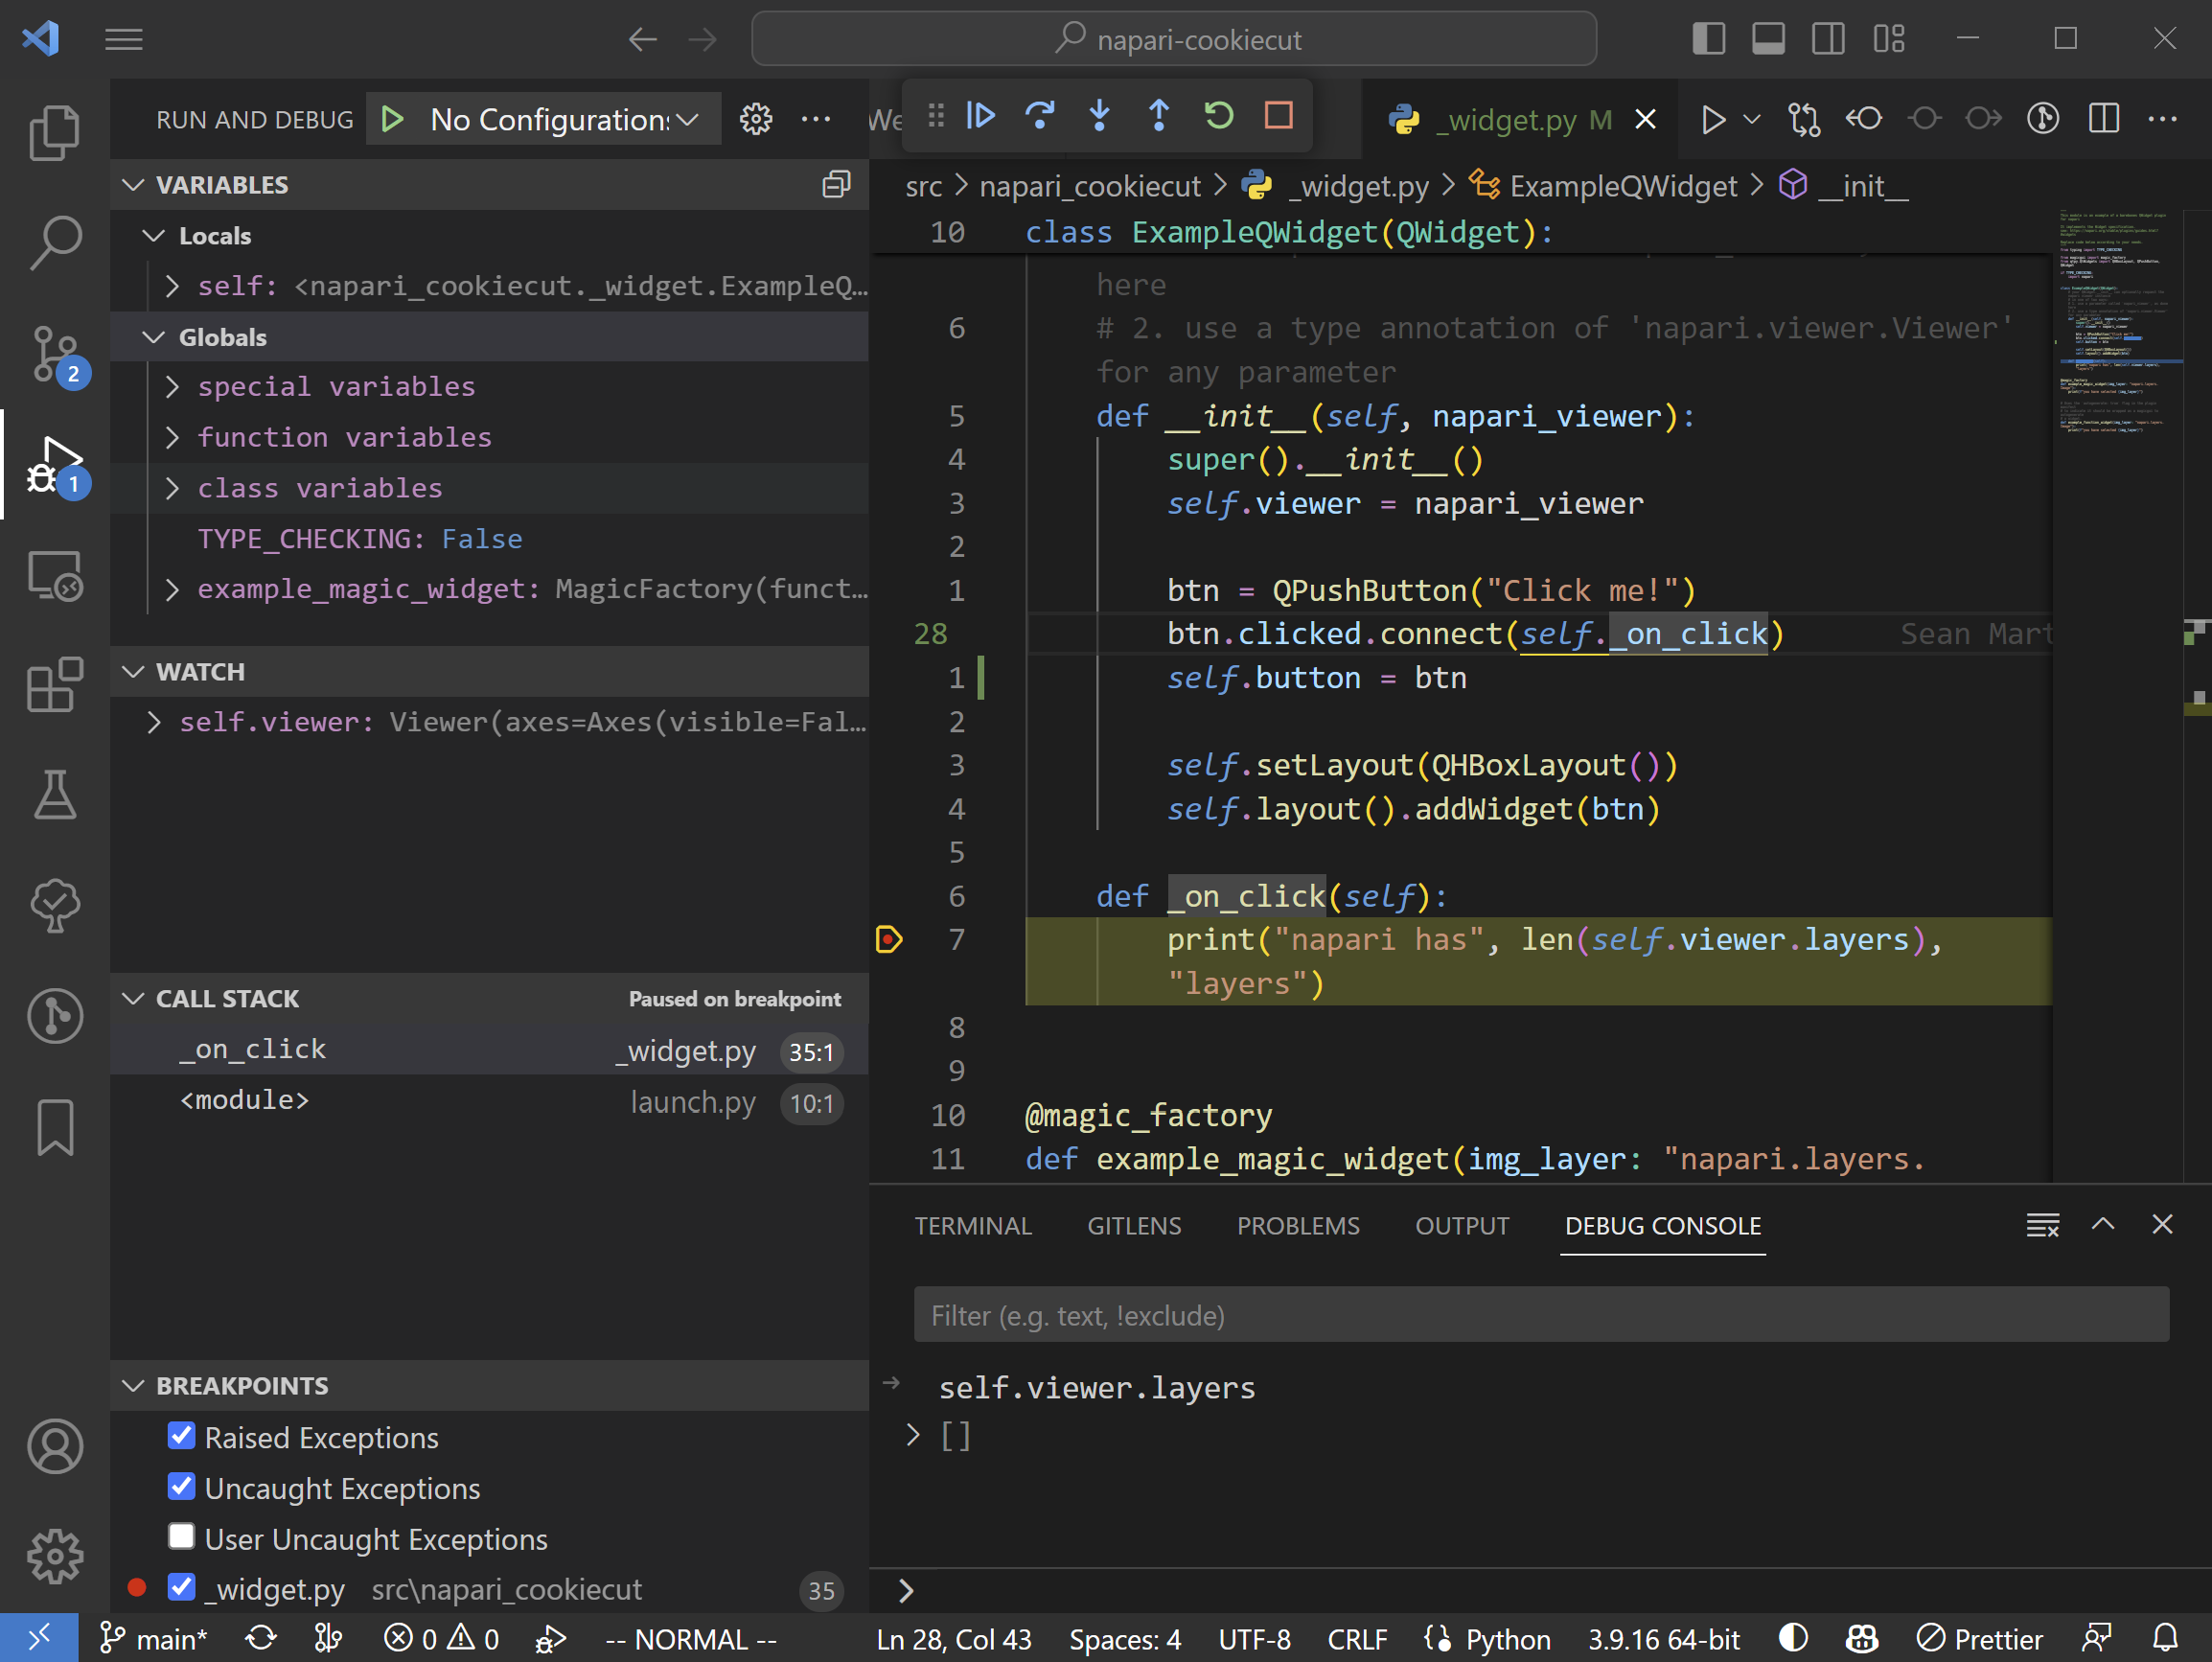
Raised Exceptionsbox in the bottom left under theBreakpointsmenu to see exceptions) you can then step through the code, inspect variables, and see the state of the napari viewer and your plugin. When you are done done debugging hit the continue button and napari will resume normal execution. See the image below for an example of a napari plugin debugging session in VSCode paused on a breakpoint.
Debugging plugin start-up issues#
It is possible that after installing your plugin, napari will fail to launch - or your plugin won’t show up. The following commands will report any issues napari detects with your plugin that may prevent napari from launching or prevent napari from discovering your plugin:
napari --plugin-info -vprints installed napari plugins, what they provide, and any issues related to these plugins.napari --infoprints key environment information related to napari, and the version of installed plugins.npe2 validate YOUR_PLUGIN_NAMEensures that your plugin has a valid manifest file.
Note
In general, napari --info is a good first step to debugging any environment issues and providing the output from this command is useful when raising bugs.
You should also ensure that:
Your plugin package is visible when you run
pip listorconda list(depending on your environment setup).Your entry point is correctly configured, see the first steps for information.
For example if pip list does show the package is installed, and npe2 validate reports success, but napari can’t see your plugin, your entry point may be ill-configured.
Seeing tracebacks from plugin errors#
By default, napari will output any traceback information from plugin related errors to the console or jupyter notebook that napari was launched from.
Additionally, a popup will show in the bottom right corner of the napari viewer with a View Traceback button.
Inside of this popup, the full traceback can be seen, along with the option to drop into the debugger from here.
Dropping into the debugger will open the built in python debugger at the point of failure.
You can also configure napari not to catch error messages, or force napari to exit on error via the following environment variables, respectively:
NAPARI_CATCH_ERRORS=0
NAPARI_EXIT_ON_ERROR=1
Overview of methods to debug plugins during development#
Reload code as you change it with IPython#
Reloading code as it changes with IPython provides an easy way to see the immediate impacts of code development without the need to relaunch the viewer multiple times.
Write a script to setup the plugin without user interaction#
Writing a setup script reproducibly places your napari viewer at the state of problems, without having to perform user interaction in the GUI to get back to the problem state. Launching napari and your plugin from a script can often allow you to use your IDE’s built in debugging tools, as long as both your plugin and napari itself are installed in editable mode in your enviroment.
Isolate the plugin functionality from napari#
To simplify the debugging process, it can be useful to isolate the execution of your plugin code from executing napari itself. For example, in the case of a widget, the widget could be isolated from napari and run separately as a PyQt widget for debugging purposes. In this way, the usual debugging tools, such as those provided by an IDE, can be applied. This method has the additional benefit of aligning with test driven development.
A simple plugin for following examples#
To demonstrate these reloading and debugging options, we will create a small plugin called napari-simple-reload that prints the text entered into a box by the user. The plugin will provide an autogenerated widget, a magic_factory widget, and a QWidget - see the contribution guides for more detail.
Firstly, clone the code with git clone https://github.com/seankmartin/napari-plugin-debug.git, or download the code here. Then install the package into an environment already containing napari by:
cd napari-plugin-debug/napari-simple-reload
python -m pip install -e .
Plugin project structure#
napari-plugin-debug/napari-simple-reload/
├── napari_simple_reload/
│   ├── __init__.py
│   ├── napari.yaml
│   └── _widget.py # We will modify this file
├── pyproject.toml
├── setup.cfg
Using IPython to reload code during plugin development#
Here, we demonstrate using the autoreload extension with IPython or a Jupyter notebook to open the napari viewer with the ability to reload the changed plugin code during development.
Launch IPython and set up the viewer#
First, we open the napari viewer and add our three plugin widgets to the dock. Launch IPython via the IPython command in terminal (IPython is installed with napari) and then enter the following into the IPython console:
In [1]: %load_ext autoreload

In [2]: %autoreload 2

In [3]: from napari import Viewer

In [4]: from magicgui import magicgui

In [5]: viewer = Viewer()

In [6]: from napari_simple_reload._widget import example

In [7]: viewer.window.add_plugin_dock_widget(
    "napari-simple-reload", "Autogenerated")

In [8]: viewer.window.add_plugin_dock_widget(
    "napari-simple-reload", "Factory")

In [9]: viewer.window.add_plugin_dock_widget(
    "napari-simple-reload", "QWidget")
Changing the code with IPython running#
Currently, clicking on the run button for any of these widgets in the napari viewer outputs “You entered YOUR_ENTRY!”. However, we would like to change the behaviour such that a special message is printed if nothing is entered. So let’s change our example function in _widget.py from the downloaded plugin code to:
def example(input_string: str) -> str:
    output_string = (
        f"You entered {input_string}!"
        if input_string
        else "Please enter something in the text box."
    )
    print(output_string)
    return output_string
To see the updated behavior in action, just type the name of your changed function into IPython, or reference it in some way:
# Run before changing the code
'You entered !'

# Run after changing the code, but before triggering an update
'You entered !'

In [10]: example # anything in IPython to reload that code

# Now the code is reloaded, run outputs as expected
'Please enter something in the text box.'
Write a setup script to avoid GUI interaction#
The key here is to use viewer.window.add_plugin_dock_widget() and then programmatically add the required information to your plugin so that when napari is launched, it launches with the required information to reproduce the problem, without having to click through the UI each time.
To continue with the example plugin shown in the last step, we want to make sure we have no sneaky bugs if the user enters text such as None, 0, or False (which all evaluate to False in Python when converted to a bool). Let’s create a setup script reproduce_issue.py and check this for the autogenerated widget:
# reproduce_issue.py
from napari import Viewer, run

viewer = Viewer()
dw, my_widget = viewer.window.add_plugin_dock_widget(
    "napari-simple-reload", "Autogenerated"
)
values_to_test = [False, 0, None]
for value in values_to_test:
    my_widget.input_string.value = value
    my_widget()

run()

# Output is:
# You entered False!
# You entered 0!
# You entered None!
Running python reproduce_issue.py will run our widget for the inputs False, 0, None. The output shows that there are no sneaky bugs, but notice how the viewer remains at the state of the last entered value of None in the text box in the GUI. This same idea can be used to set up the GUI to a point of failure without having to manually input all the user interactions - and can help better identify the issue.
Isolate the issue from napari#
This solution ties in with the idea of test-driven development (see the napari testing guidelines). The idea is to trust that napari will provide the information you expect it to, and test your widgets independently of the viewer. In the case above we can verify that input values work as expected like so:
# test_print.py
from napari_simple_reload._widget import example_factory

def test_false_inputs():
    values_to_test = [False, 0, None]
    for value in values_to_test:
        wdg = example_factory(input_string={"value": str(value)})
        result = wdg()
        assert result == f"You entered {value}!"

if __name__ == "__main__":
    test_false_inputs()
Then, for python test_print.py you can use any of your usual debugging tools - such as the visual debugger provided by a Python IDE (e.g. PyCharm, VSCode, or Spyder). Further, an isolated test like this can be integrated into a testing suite for your napari plugin.
Logging and user messages in napari#
Set up plugin user messages and notifications#
There are, generally speaking, three main methods for notifying users of problems in napari.
Raise an exception to indicate a breaking problem in the code (e.g. unexpected user input
raise ValueError("some error")).Indicate that something was handled, but may not be the behaviour the user was expecting using
warnings.warn("some warning").Show an information popup in the napari GUI by using the
napari.utils.notifications.show_info("message")command.
Set up plugin log messages#
In addition to these user focused methods, you can set up plugin debug logs and messages during development. You can either use napari specific functions, or built in Python logging.
Tip
A logging library, like loguru, can be easier to get started with than the built in Python logging library.
Below is an example of establishing debug messages and logs in your code and viewing them in napari by setting the preferences for GUI notifications and console notifications to be at the debug level. We modify the example function from before to have a debug log message:
import logging
import sys
from napari.utils.notifications import (
    notification_manager,
    Notification,
    NotificationSeverity,
    show_console_notification,
)

my_plugin_logger = logging.getLogger("napari_simple_reload")
stdout_handler = logging.StreamHandler(sys.stderr)
stdout_handler.setFormatter(
    logging.Formatter(
        fmt="%(levelname)s: %(asctime)s %(message)s",
        datefmt="%d/%m/%Y %I:%M:%S %p"
    )
)
my_plugin_logger.addHandler(stdout_handler)
my_plugin_logger.setLevel(logging.WARNING)

def show_debug(message: str):
    """
    Show a debug message in the notification manager.
    """
    notification_ = Notification(
        message, severity=NotificationSeverity.DEBUG)
    # Show message in the console only
    show_console_notification(notification_)
    # Show message in console and the napari GUI
    notification_manager.dispatch(notification_)
    # Control level of shown messages via napari preferences

def example(input_string: str) -> str:
    output_string = (
        f"You entered {input_string}!"
        if input_string
        else "Please enter something in the text box."
    )
    show_debug(f"The input string was (napari): {input_string}")
    my_plugin_logger.debug(
        f"The input string was (logging): {input_string}")
    print(output_string)
    return output_string
Viewing plugin log messages#
Launch the viewer with the napari notification levels set to debug and your plugin logger level set to debug:
# example_notication.py
import logging
from napari.settings import get_settings
from napari import run, Viewer

settings = get_settings()
settings.application.console_notification_level = "debug"
settings.application.gui_notification_level = "debug"
viewer = Viewer()
viewer.window.add_plugin_dock_widget(
  "napari-simple-reload", "Autogenerated"
)
logging.getLogger("napari_simple_reload").setLevel(logging.DEBUG)
run()
Running this script with python example_notification.py and entering fast into the input text box and clicking run you should then see:
DEBUG: The input string was (napari): fast
# A GUI notification of the same
DEBUG: The input string was (napari): fast
DEBUG: 20/09/2022 05:59:23 PM The input string was (logging): fast
'You entered fast!'
The full code changes and new files after applying the changes to the plugin in each step of the examples are here.
Debugging segfaults/memory violation errors#
If napari crashes with a segfault or memory violation error when using your plugin it may be connected with setting some viewer/layers properties outside main thread. Because of the limitations of the Qt library, such interactions with napari may lead to a crash.
To test if this is the case, you can use the NAPARI_ENSURE_PLUGIN_MAIN_THREAD environment variable to help debug the issue.
Set the environement variable: NAPARI_ENSURE_PLUGIN_MAIN_THREAD=1, then start napari and run your plugin.
NAPARI_ENSURE_PLUGIN_MAIN_THREAD=1 napari
Next, start using your plugin and observe if
RuntimeError("Setting attributes on a napari object is only allowed from the main Qt thread.")
occurred. If so, then you need to make sure that all of your plugin code that interacts with napari structures is executed
in the main thread. For more details you could read the multithreading section of the documentation.