Goal: Navigate the viewer confidently, adjust how images look, try the napari gallery, and understand image metadata.
Instructor-guided GUI Walkthrough (25 min)
Follow along as the instructor walks through the major parts of the napari interface using the Cells (3D + 2Ch) sample image.
Check out the napari viewer documentation for a full walkthrough.
The Viewer Layout
| Area | Purpose |
|---|---|
| Canvas (center) | Where your image is displayed |
| Dimension sliders (bottom) | Scrub through z, t, or other axes |
| Viewer buttons (bottom-left) | 2D/3D toggle, home, grid, axes, scale bar |
| Layer list (left) | All open layers; click to select, eye to toggle visibility |
| Layer controls (top-left) | Adjust appearance of the selected layer |
Key Interactions
Zoom: right-click and drag or scroll wheel (or two-finger scroll on trackpad)
Pan: click and drag on the canvas, hold Shift to pan in 3D mode
Reset view: click the home button (bottom-right row of viewer buttons)
Dimension Sliders
When a layer has more dimensions than the viewer can display, sliders appear at the bottom of the canvas. Drag a slider to move through z-slices, time points, or channels.
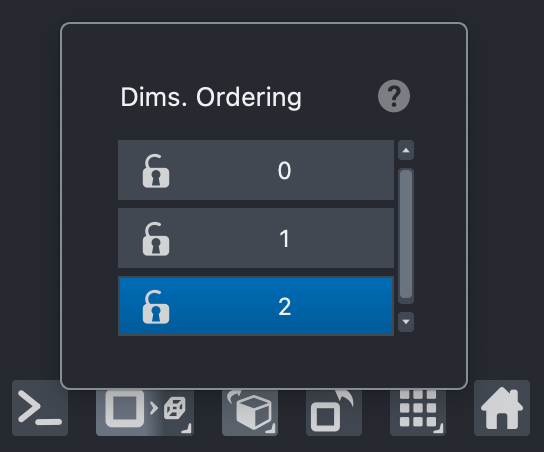
You can rename the slider labels! Right click on the roll dimensions button and double-click on the axis label to edit it.
2D ↔ 3D Toggle
Click the 2D/3D button in the viewer button row to switch rendering modes. In 3D mode you can click-drag to rotate the volume.

Overlays
There are viewer overlays that can be added to the canvas. In this case we will add the Axes overlay to show the Axis Labels attached to the data. Go to View > Axes > Axes Visible to turn it on.
Try also to visualize the Color Bar (LUT) overlay for each layer by right clicking on the layer(s) that you want to visualize or toggle the color bar from the navbar menu Layers > Measure > Color Bar.
We can also enable the scale bar with View > Scale Bar > Visible from the navbar. If all layers have consistent units, then the scalebar displays the physical scale. If not, it defaults to pixels.
Layer Controls
With a layer selected, layer controls at the top-left let you change:
Contrast limits — adjust brightness/darkness and auto-contrast
Colormap — the colour used to display intensity values
Blending — how layers are composited
Opacity — layer transparency
Grid View
Grid Mode allows you to view multiple layers in separate panels at the same time. This is especially useful for comparing channels in a multi-channel image. You can enable it with the grid button in the viewer buttons (bottom row, second from the right). You can right-click the grid button to adjust the number of rows and columns in the grid, including how many layers are shown in each panel (i.e. stride).
Console Peek
napari has a built-in Python console that allows you to interact with the viewer programmatically. Some features that are not yet exposed through the GUI can be used via the console.
Open it from the menu with Window > Console, or click the leftmost viewer button.
As an example, here we change the viewer scale bar units (you can’t do this through the GUI yet):
viewer.scale_bar.unit = 'micrometer'The console lets you access the viewer directly to programmatically
change different properties. You can also access individual
layers using viewer.layers — the starting point for scripting napari in
your own workflows.
Layer Metadata with napari-metadata (5 min)
The napari-metadata plugin lets you view and edit layer metadata, including axis labels, scale, and physical units of your layers — essential for making measurements in real units.
Open the widget: Plugins > Layer metadata: Layer metadata
There are three parts to the widget:
File metadata — read-only metadata from the file
Axes metadata — axis labels, physical scale, units, and more
Copy metadata — copy metadata from one layer to another
Gallery Exploration Breakout (15 min)
Recommended Examples
3D Layer Bounding Box Overlay
3D vector field and image across time
Add labels with features
Add points 3D
Add vectors color by angle
Anisotropic data with scale
Annotate segmentation with text
Colorbars and auto-tiling of overlays in grid mode
Displaying xarray data in napari
Features table widget
Heart with multiple annotations
Image points 3D
Labels 3D
Minimum blending
Show points based on feature
Surface with texture and vertex_oolors
Tracks 3D
Sharing Time (5 min)
What did you find in the gallery? (check the Zulip stream for screenshots!)
Any surprising layer types or visualizations?
Questions about the interface?