Goal: Install a plugin from the napari hub, open images with it, and manually annotate images using Points, Shapes, and Labels layers.
Plugins and the napari Hub (5 min)
napari’s functionality can be extended with plugins — Python packages contributed by the community.
Plugins can add:
| Type | What it enables |
|---|---|
| Readers | Open file formats napari doesn’t know by default |
| Writers | Save layers to custom formats |
| Widgets | New GUI panels for analysis, measurement, etc. |
| Sample data | Built-in example datasets |
Browse and search for plugins at napari-hub.org.
Installing a plugin from within napari:
Plugins > Install/Uninstall Plugins…
Search by name in the top search bar
Click Install next to the plugin you want
(Restart napari when prompted)
Opening Images with ndevio (10 min)
ndevio is a plugin that adds enhanced reading support for a wide range of file formats, including OME-TIFF and BigTIFF.
Today we’ll be using it to look at an example TIFF file from the QuPath documentation.
Download your TIFF:
Click this link to download your image so it’s available on your device.
Install ndevio:
Plugins > Install/Uninstall Plugins… → search
ndevio→ InstallYou will see a warning about installing the plugin from PyPI. The napari bundle typically uses
condato manage packages and plugins. A plugin installed from PyPI may interact with other installed packages so we encourage usingcondawhen available. In this case, we know this plugin will work fine.
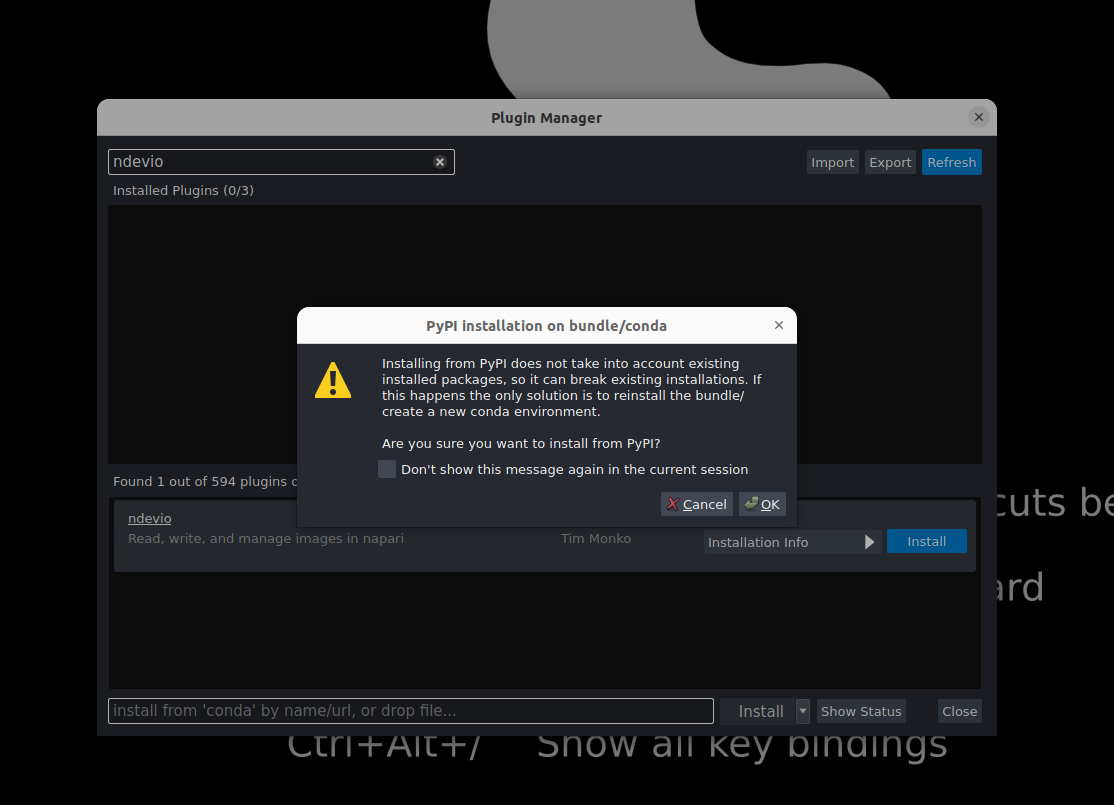
Click OK.
Once the plugin is installed, close the plugin manager and restart napari, as advised.
Open an image:
File > Open File(s) to open any
.tifor.tifffile, or drag-and-drop onto the canvasYou will be asked which plugin you want to use to open the file. Choose
ndevio.You may see an error (and no image open) when first trying to open a
.tifffile withndevio. If you see this error, try opening the file again.If opening the file was successful, you may see a new GUI element on the right side of the viewer. This is because some TIFF files have multiple different scenes bundled into the same file e.g. one scene for each imaged region of interest (e.g. well, slide, sample). Click on one of the detected scenes. You’ll see the images added as layers to the viewer.
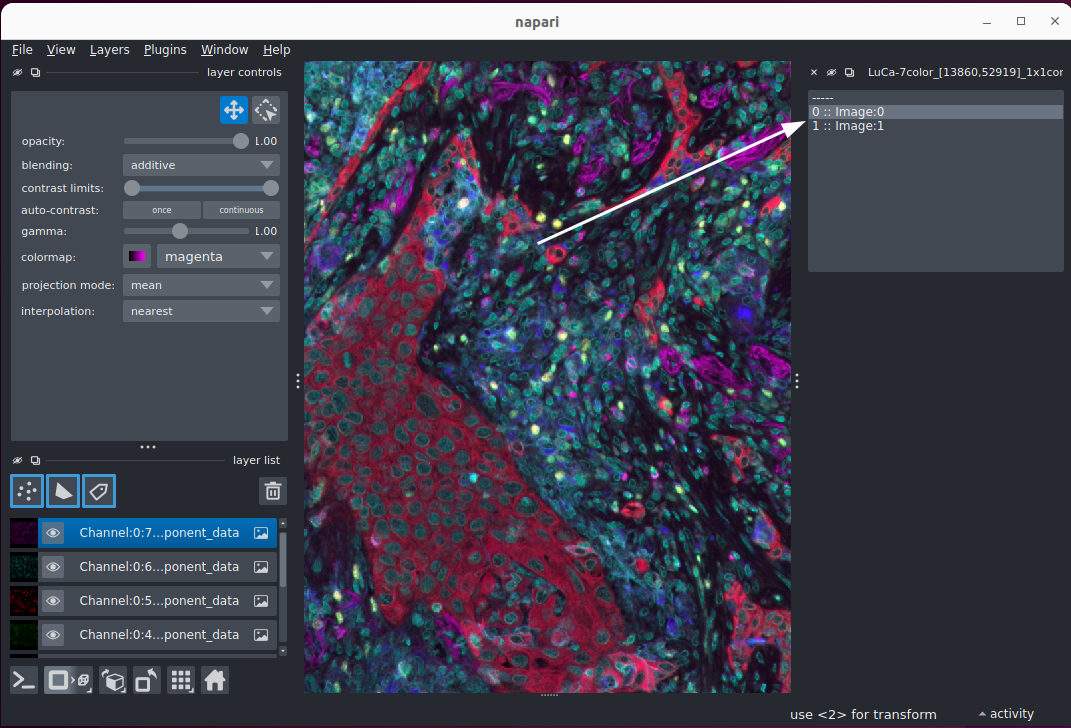
If you’d like to read other different file types with ndevio, check out its documentation.
napari-ome-zarr and the IDR (10 min)
napari-ome-zarr lets you
stream images directly from the web — no download required. The
Image Data Resource (IDR) hosts thousands
of public bioimages in OME-Zarr format.
You will first need to install napari-ome-zarr from the napari plugin manager.
To open a remote image there are a few ways:
Drag-drop a URL onto the canvas or copy the url and select the
napari-ome-zarrpluginFile > New Image from Clipboard (Ctrl+N or Cmd+N)
On some platforms, use File > Open File(s) and paste the URL into the filepath entry
While you can try any image on the IDR, we suggest starting with any from the OME-NGFF Samples collection that is OME-NGFF version 0.4 or 0.5 and drag-dropping the url onto the canvas. You can also browse the 2024 NGFF Challenge datasets and filter by dimension count, organism, and modality to find something interesting to you. For NGFF Challenge datasets, press the “Copy” icon to copy the URL to your clipboard use option 2 or 3 from the file menu above.
After it loads, open napari-metadata (Plugins > napari-metadata: Metadata Widget) and examine the axis names and pixel scales the images come with.
Sharing Time (5 min)
What did you open? (check the Zulip stream for screenshots!)
What did the metadata widget show for axis scales and units?
Any plugins you found interesting while browsing napari-hub?
What Is Annotation? (5 min)
Manual annotation means marking up images by hand. Common reasons:
Training data for machine learning segmentation models
Quality control of automated results
Counting cells, events, or structures of interest
Region-of-interest selection for downstream analysis
Two fundamental approaches:
| Approach | napari layer | When to use |
|---|---|---|
| Vector | Points, Shapes | Marking locations, outlines |
| Raster | Labels | Pixel-wise segmentation masks |
Annotation with Points and Shapes (10 min)
Use the Cells (3D + 2Ch) sample for this exercise. You may use annotation.py to have a base visualization for modification.
Points layer — marking cell centers
In the layer list, click Add Points layer (the points icon in the top-left) — or go to Layer > New Points Layer
In layer controls, ensure the Add points tool is active (circle icon with a + inside)
Click on cell centers in the
nucleilayer to add a point at each locationEach click drops a point; Use the Backspace/Delete key to remove the last added point (or the x icon)
Switch to the Select tool to move existing points
Compare visualization in 2D with checking out_of_slice_display in layer controls — it shows points that are outside the current z-slice.
Shapes layer — outlining a region
Manual shape drawing and modification is currently possible in 2D only. N-dimensional shapes can be added programmatically.
Add a shapes layer: Layer > New Shapes Layer
Choose a shape tool from layer controls (rectangle, ellipse, polygon, etc.) and try it out The Polygon (
P) and Polygon Lasso (Shift+P) are especially useful for irregular shapes.You can modify the edge width, edge color and face color in the layer controls for individual shapes.
Use the Select Shapes (
5orS) tool to resize or move shapes. Individual vertices can be modified with the Select Vertices (4orD) tool.
Labels layer — painting a cell
Add a labels layer: Layer > New Labels Layer (choose the size to match your image)
Select the Paint tool from layer controls and pick a brush size. You can hold Alt and move the cursor left and right to adjust the brush size.
Paint over one cell to label it — each label value is a different integer (colour). You can change the label ID in the layer controls. To set the label ID to the largest existing label + 1, press
mon your keyboard.Use Fill to flood-fill an enclosed region. The behavior is quite different in 2D compared to 3D, so try it out in both contexts.
Use the Eraser tool to remove part of a label. It works like the paint tool, but instead of adding pixels to a label, it removes them (sets to 0). This is especially worth trying in 3D!
Converting Shapes (ROIs) to labels
There is currently no Polygon painting tool; however, you can convert Shapes layers to Labels layers to rasterize annotations. This is useful when you want to create a mask image from manually drawn ROIs.
First, switch to 2D view. Then, Right Click on the Shapes layer in the layer list and select Convert to Labels. This creates a new Labels layer where each shape is filled in with a different integer value (label).
Saving Annotations
You can save any annotation layer via File > Save Selected Layer(s) as a tiff (labels) or csv/shapefile (shapes/points) with the builtin napari writer, but layer metadata is not saved with the data. Some writer plugins do support this — check the napari-hub for options.