Using the shapes layer#
In this document, you will learn about the napari Shapes layer, including
how to display and edit shapes like rectangle, ellipses, polygons, paths, and
lines. You will also understand how to add a shapes layer and edit it from the
GUI and from the console.
When to use the shapes layer#
The Shapes layer allows you to display a list of an NxD arrays, where each array
corresponds to one shape, specified by N points in D coordinates. You can adjust
the position, size, face color, edge color, and opacity of all the shapes
independently, both programmatically and from the GUI.
A simple example#
You can create a new viewer and add a list of shapes in one go using the
napari.view_shapes method, or if you already have an existing viewer, you can
add shapes to it using viewer.add_shapes. The api of both methods is the same.
In these examples we’ll mainly use add_shapes to overlay shapes onto on an
existing image.
In this example, we will overlay some shapes on the image of a photographer:
import napari
import numpy as np
from skimage import data

# create the list of polygons
triangle = np.array([[11, 13], [111, 113], [22, 246]])

person = np.array([[505, 60], [402, 71], [383, 42], [251, 95], [212, 59],
                   [131, 137], [126, 187], [191, 204], [171, 248], [211, 260],
                   [273, 243], [264, 225], [430, 173], [512, 160]])

building = np.array([[310, 382], [229, 381], [209, 401], [221, 411],
                     [258, 411], [300, 412], [306, 435], [268, 434],
                     [265, 454], [298, 461], [307, 461], [307, 507],
                     [349, 510], [352, 369], [330, 366], [330, 366]])

polygons = [triangle, person, building]

# add the image
viewer = napari.view_image(data.camera(), name='photographer')

# add the polygons
shapes_layer = viewer.add_shapes(polygons, shape_type='polygon', edge_width=5,
                          edge_color='coral', face_color='royalblue')
Show code cell source
from napari.utils import nbscreenshot

nbscreenshot(viewer, alt_text="Shapes overlaid on image")

Arguments of view_shapes and add_shapes#
view_shapes() and add_shapes()
accept the same layer-creation parameters.
Show code cell content
help(napari.view_shapes)
Help on function view_shapes in module napari.view_layers:

view_shapes(data=None, *, ndim=None, features=None, feature_defaults=None, properties=None, property_choices=None, text=None, shape_type='rectangle', edge_width=1, edge_color='#777777', edge_color_cycle=None, edge_colormap='viridis', edge_contrast_limits=None, face_color='white', face_color_cycle=None, face_colormap='viridis', face_contrast_limits=None, z_index=0, name=None, metadata=None, scale=None, translate=None, rotate=None, shear=None, affine=None, opacity=0.7, blending='translucent', visible=True, cache=True, experimental_clipping_planes=None, title='napari', ndisplay=2, order=(), axis_labels=(), show=True) -> napari.viewer.Viewer
    Create a viewer and add a shapes layer.

    Parameters
    ----------
    data : list or array
        List of shape data, where each element is an (N, D) array of the
        N vertices of a shape in D dimensions. Can be an 3-dimensional
        array if each shape has the same number of vertices.
    ndim : int
        Number of dimensions for shapes. When data is not None, ndim must be D.
        An empty shapes layer can be instantiated with arbitrary ndim.
    features : dict[str, array-like] or Dataframe-like
        Features table where each row corresponds to a shape and each column
        is a feature.
    feature_defaults : dict[str, Any] or Dataframe-like
        The default value of each feature in a table with one row.
    properties : dict {str: array (N,)}, DataFrame
        Properties for each shape. Each property should be an array of length N,
        where N is the number of shapes.
    property_choices : dict {str: array (N,)}
        possible values for each property.
    text : str, dict
        Text to be displayed with the shapes. If text is set to a key in properties,
        the value of that property will be displayed. Multiple properties can be
        composed using f-string-like syntax (e.g., '{property_1}, {float_property:.2f}).
        A dictionary can be provided with keyword arguments to set the text values
        and display properties. See TextManager.__init__() for the valid keyword arguments.
        For example usage, see /napari/examples/add_shapes_with_text.py.
    shape_type : string or list
        String of shape shape_type, must be one of "{'line', 'rectangle',
        'ellipse', 'path', 'polygon'}". If a list is supplied it must be
        the same length as the length of `data` and each element will be
        applied to each shape otherwise the same value will be used for all
        shapes.
    edge_width : float or list
        Thickness of lines and edges. If a list is supplied it must be the
        same length as the length of `data` and each element will be
        applied to each shape otherwise the same value will be used for all
        shapes.
    edge_color : str, array-like
        If string can be any color name recognized by vispy or hex value if
        starting with `#`. If array-like must be 1-dimensional array with 3
        or 4 elements. If a list is supplied it must be the same length as
        the length of `data` and each element will be applied to each shape
        otherwise the same value will be used for all shapes.
    edge_color_cycle : np.ndarray, list
        Cycle of colors (provided as string name, RGB, or RGBA) to map to edge_color if a
        categorical attribute is used color the vectors.
    edge_colormap : str, napari.utils.Colormap
        Colormap to set edge_color if a continuous attribute is used to set face_color.
    edge_contrast_limits : None, (float, float)
        clims for mapping the property to a color map. These are the min and max value
        of the specified property that are mapped to 0 and 1, respectively.
        The default value is None. If set the none, the clims will be set to
        (property.min(), property.max())
    face_color : str, array-like
        If string can be any color name recognized by vispy or hex value if
        starting with `#`. If array-like must be 1-dimensional array with 3
        or 4 elements. If a list is supplied it must be the same length as
        the length of `data` and each element will be applied to each shape
        otherwise the same value will be used for all shapes.
    face_color_cycle : np.ndarray, list
        Cycle of colors (provided as string name, RGB, or RGBA) to map to face_color if a
        categorical attribute is used color the vectors.
    face_colormap : str, napari.utils.Colormap
        Colormap to set face_color if a continuous attribute is used to set face_color.
    face_contrast_limits : None, (float, float)
        clims for mapping the property to a color map. These are the min and max value
        of the specified property that are mapped to 0 and 1, respectively.
        The default value is None. If set the none, the clims will be set to
        (property.min(), property.max())
    z_index : int or list
        Specifier of z order priority. Shapes with higher z order are
        displayed ontop of others. If a list is supplied it must be the
        same length as the length of `data` and each element will be
        applied to each shape otherwise the same value will be used for all
        shapes.
    name : str
        Name of the layer.
    metadata : dict
        Layer metadata.
    scale : tuple of float
        Scale factors for the layer.
    translate : tuple of float
        Translation values for the layer.
    rotate : float, 3-tuple of float, or n-D array.
        If a float convert into a 2D rotation matrix using that value as an
        angle. If 3-tuple convert into a 3D rotation matrix, using a yaw,
        pitch, roll convention. Otherwise assume an nD rotation. Angles are
        assumed to be in degrees. They can be converted from radians with
        np.degrees if needed.
    shear : 1-D array or n-D array
        Either a vector of upper triangular values, or an nD shear matrix with
        ones along the main diagonal.
    affine : n-D array or napari.utils.transforms.Affine
        (N+1, N+1) affine transformation matrix in homogeneous coordinates.
        The first (N, N) entries correspond to a linear transform and
        the final column is a length N translation vector and a 1 or a napari
        `Affine` transform object. Applied as an extra transform on top of the
        provided scale, rotate, and shear values.
    opacity : float
        Opacity of the layer visual, between 0.0 and 1.0.
    blending : str
        One of a list of preset blending modes that determines how RGB and
        alpha values of the layer visual get mixed. Allowed values are
        {'opaque', 'translucent', and 'additive'}.
    visible : bool
        Whether the layer visual is currently being displayed.
    cache : bool
        Whether slices of out-of-core datasets should be cached upon retrieval.
        Currently, this only applies to dask arrays.
        title : string, optional
        The title of the viewer window. By default 'napari'.
    ndisplay : {2, 3}, optional
        Number of displayed dimensions. By default 2.
    order : tuple of int, optional
        Order in which dimensions are displayed where the last two or last
        three dimensions correspond to row x column or plane x row x column if
        ndisplay is 2 or 3. By default None
    axis_labels : list of str, optional
        Dimension names. By default they are labeled with sequential numbers
    show : bool, optional
        Whether to show the viewer after instantiation. By default True.


    Returns
    -------
    viewer : :class:`napari.Viewer`
        The newly-created viewer.
Shapes data#
The input data to the shapes layer must be a list of NxD numpy array, with each
array containing the coordinates of the N vertices in D dimensions that make up
the shape. The ordering of these dimensions is the same as the ordering of the
dimensions for image layers. This list of arrays is always accessible through
the layer.data property and will grow or shrink as new shapes are either added
or deleted. By storing data as a list of arrays it is possible for each shape to
have a different number of vertices in it. This is especially useful when
drawing polygons or paths.
Adding different shape types#
Right now the shapes layer supports 5 types of shapes, Lines, Rectangles,
Ellipses, Polygons, and Paths. When adding new data can set the shape type
through the shape_type keyword argument, as either a single shape type if all
the shapes to be added have the same type or as a list of shape types if some of
the shapes have different types. The actual shape types of all the shapes is
accessible through the layer.shape_types property. Selecting different shape
creation tools will cause shapes of the different types to be added.
Lines consist of two vertices representing the end points of the line. The
line creation tool can be selected from the layer control panel or by pressing
the L key when the shapes layer is selected. When adding a new line the first
click will coordinates of the first endpoint and the second click will mark the
coordinates of the second endpoint. You’ll then be able to add another line.
Rectangles can be added using two vertices representing the corners of the
rectangle for axis aligned rectangle, or using four corners so that non-axis
aligned rectangle can be represented too. Internally we use the four vertex
representation so we can always support rotated rectangles. The rectangle
creation tool can be selected from the layer control panel or by pressing the
R key when the shapes layer is selected. When adding a rectangle you must
click and drag the rectangle to have the desired shape. When you release the
mouse the rectangle will be completed and you’ll then be able to add another
one. If you just make a single click then a rectangle of default size will be
created centered on that click.
Ellipses can be added using either two vectors, one representing the center
position of the ellipse and the other representing the radii of the ellipse in
all dimensions for an axis aligned ellipse, or by using the four corners of the
ellipse bounding box for a non-axis aligned ellipse. Internally we use the four
vertex representation so we can always support rotated ellipses. The ellipse
creation tool can be selected from the layer control panel or by pressing the
E key when the shapes layer is selected. When adding an ellipse you must click
and drag the ellipse to have the desired shape. When you release the mouse the
ellipse will be completed and you’ll then be able to add another one. If you
just make a single click then an ellipse of default size will be created
centered on that click.
Polygons can be added using an array of N vertices. Polygons are closed by
default, and so you don’t also need to include the first point at the end of the
array. The order of the vertices will determine the triangulation of the
polygon, which can be non-convex, but cannot have holes. For drawing polygons,
multiple tools can be used.
The polygon creation tool can be selected from the layer control panel or by
pressing the P key when the shapes layer is selected. When adding a polygon
each click will add a vertex at the clicked location. To finish drawing a polygon
you must click theescape key, which will add a final vertex at the current mouse
position and complete the polygon. You’ll then be able to start adding another one.
Polygons can also be created with the polygon lasso creation tool, which can be
found in the layer control panel or by pressing shift+P. The tool can be used to
draw complex Polygons with the mouse
or tablet. When using the mouse, the sequence of events to draw a polygon is as
follows:
Click mouse (left-click) to begin drawing.
Move mouse — without holding down the mouse button — to draw the polygon.
Click mouse (left-click) or press
escapeto end drawing—the polygon will auto-complete.
The polygon lasso tool can also be used to draw Polygons using a tablet. In this case,
drawing the polygon is started by touching the tablet screen with the tablet stylus and
drawing will continue for as long as the pencil is moved while touching the tablet screen.
Note that similar behavior is also available when using a macOS trackpad, using three-finger
drag mode.
For both modes, vertices are added only if the vertex to be added is at a certain number of screen pixels
away from the previous vertex. This value can be adjusted in the settings in napari by going to
File -> Preferences (or control + shift + P), then in the menu on the left-clicking on
Experimental and then adjusting the value of Minimum distance threshold of shapes lasso tool.
The default is 10 and can be any integer higher than 0 and lower than 50. As with the polygon creation
tool drawing the shape can also be finished by pressing the escape key.
After finishing drawing a polygon using the polygon lasso tool, an implementation of the Ramer–Douglas–Peucker
algorithm is applied to reduce the
number of vertices that make up the shape, while preserving its contours. The aggressiveness with
which the algorithm reduces the number of vertices of the polygon is determined by an epsilon parameter,
which is a perpendicular distance threshold. Any vertices beyond the threshold will be preserved, so
if epsilon is set to 0, no vertices will be removed. With increasing values of epsilon, more and
more vertices will be removed. The value of epsilon can be set in napari by going to
File -> Preferences (or control + shift + P), then in the menu on the left-clicking on
Experimental and then adjusting the value of RDP epsilon. The default value is 0.5 and cannot
set lower than 0.
Paths are like polygons but are not closed or filled in. They can also be
added using an array of N vertices. The path creation tool can be selected from
the layer control panel or by pressing the T key when the shapes layer is
selected. When adding a path each click will add a vertex at the clicked
location. To finish drawing a path you must click the escape key, which will
add a final vertex at the current mouse position and complete the path. You’ll
then be able to start adding another one.
When using the shapes addition or editing tools the pan and zoom functionality of the viewer canvas is disabled and you can edit the layer. You can temporarily re-enable pan and zoom by pressing and holding the spacebar. This feature can be useful if you want to move around the shapes layer as you edit it.
Adding new shapes#
You can add new shapes to an existing Shapes layer programmatically by using
the add method, which allows you to pass in a shape_type list when you
have mixed shape data.
import napari
import numpy as np
from skimage import data

# add the image
viewer = napari.view_image(data.camera(), name='photographer')

# create a triangle
triangle = np.array([[11, 13], [111, 113], [22, 246]])

# create an ellipse
ellipse = np.array([[59, 222], [110, 289], [170, 243], [119, 176]])

# put both shapes in a list
mixed_shapes = [triangle, ellipse]

# add an empty shapes layer
shapes_layer = viewer.add_shapes()

# add mixed shapes using the `add` method
shapes_layer.add(
  mixed_shapes,
  shape_type=['polygon', 'ellipse'],
  edge_width=5,
  edge_color='coral',
  face_color='royalblue'
)
Show code cell source
from napari.utils import nbscreenshot

nbscreenshot(viewer, alt_text="Add new shapes to an existing shapes layer")

Finally, each shape type has its own convenience method for adding new shapes
to a layer. Their arguments are identical to those of the add method, but
they do not take a shape_type.
import napari
import numpy as np
from skimage import data

# add the image
viewer = napari.view_image(data.camera(), name='photographer')

# create some ellipses
ellipse = np.array([[59, 222], [110, 289], [170, 243], [119, 176]])

ellipse2 = np.array([[165, 329], [165, 401], [234, 401], [234, 329]])

# put both shapes in a list
ellipses = [ellipse, ellipse2]

# add an empty shapes layer
shapes_layer = viewer.add_shapes()

# add ellipses using their convenience method
shapes_layer.add_ellipses(
  ellipses,
  edge_width=5,
  edge_color='coral',
  face_color='royalblue'
)
Show code cell source
from napari.utils import nbscreenshot

nbscreenshot(viewer, alt_text="Add new ellipses to an existing shapes layer using the specific method for this layer type")

Creating a new shapes layer#
As you can add new shapes to a shapes layer using the various shape creation tools, it is possible to create a brand-new empty shapes layers by clicking the new shapes layer button above the layers list. The shape of the shapes layer is defined by the shapes inside it, and so as you add new shapes the shape will adjust as needed. The dimension of the new shapes layer will default to the largest dimension of any layer currently in the viewer, or to 2 if no other layers are present in the viewer.
Non-editable mode#
If you want to disable editing of the shapes layer you can set the editable
property of the layer to False.
As note in the section on 3D rendering, when using 3D rendering the shapes layer is not editable.
3D rendering of shapes#
All our layers can be rendered in both 2D and 3D mode, and one of our viewer
buttons can toggle between each mode. The number of dimensions sliders will be 2
or 3 less than the total number of dimensions of the layer. See for example the
examples/nD_shapes.py
to see shapes in both 2D and 3D:
Note though that when entering 3D rendering mode the shape editing tools are all disabled. Those options are only supported when viewing a layer using 2D rendering.
Also note that for a multidimensional shape to be displayed on a given view slice all of its non-displayed coordinates must match the coordinates of that view slice, i.e. the shape must be entirely defined within that plane.
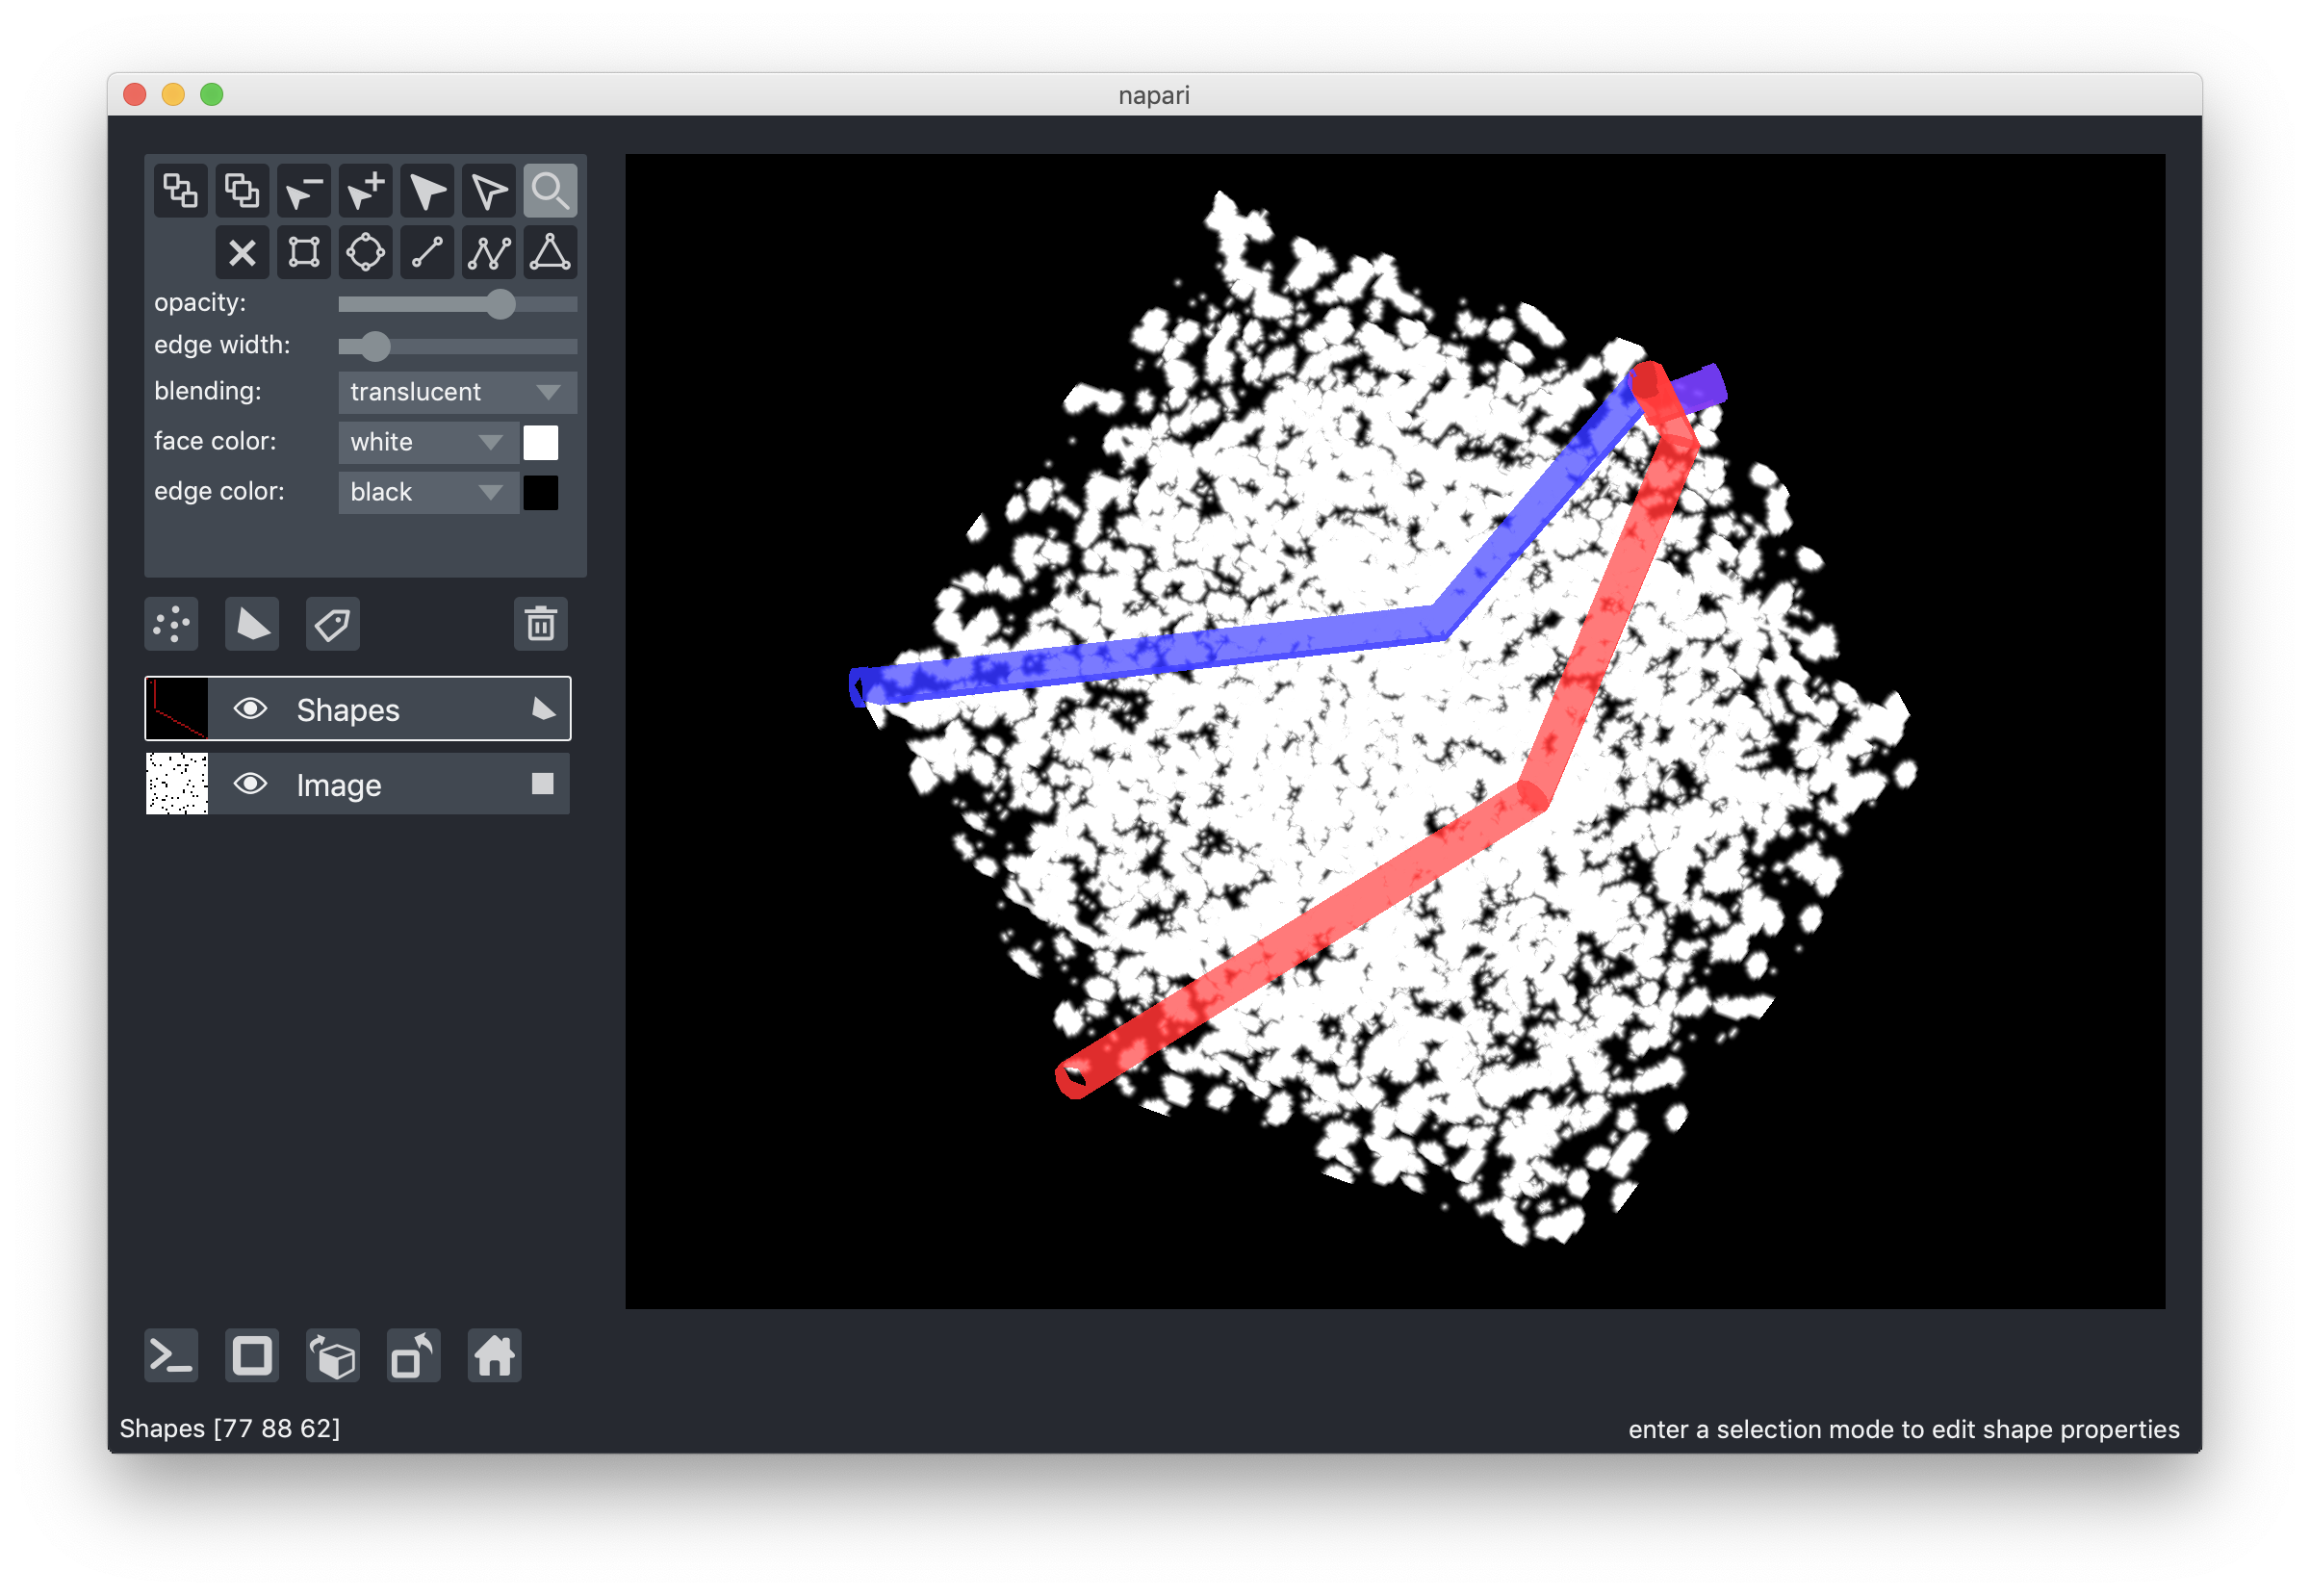
For paths that are defined by coordinates spanning more than two dimensions, it
is possible to visualize them as 3D cylinders, see for example the
examples/3D_paths.py
Note
Right now, it is not possible to display 3D cuboids or 3D spheroids, but will be supporting those options soon.
Pan and zoom mode#
The default mode of the shapes layer is to support panning and zooming, as in
the image layer. This mode is represented by the magnifying glass in the layers
control panel, and while it is selected editing the layer is not possible.
Continue reading to learn how to use some of the editing modes. You can always
return to pan and zoom mode by pressing the Z key when the shapes layer is
selected.
Selecting, resizing, moving, and deleting shapes#
New shapes can be added using one of the 5 shape creation tools, for Lines,
Rectangles, Ellipses, Polygons, and Paths. For more information on the
different shape types see the shape types section.
You can select a shape by clicking on it using the shape selection tool, which
can be selected by clicking on it in the layer controls panel or by pressing the
S key when the shapes layer is selected. Once selected you can move the shape
by dragging it. You can also resize the shape by clicking and dragging on one of
the handles along the edge of the shape bounding box. You can also rotate the
shape by clicking and dragging on the rotation handle above the shape bounding
box.
When resizing a layer if you hold down the shift key the aspect ratio of the
shape will lock and you can continue to resize the shape now with a fixed aspect
ratio.
You can select multiple shapes by continuing to shift click on additional shapes after the first, or by dragging a bounding box around the shapes you want to select.
You can select all the shapes in the currently viewed slice by clicking the A
key if you are in select mode.
Once selected you can delete the selected shapes by clicking on the delete button in the layer controls panel or pressing the delete key.
For example see below:
Adding, moving, and deleting individual vertices#
You can move individual vertices by entering the direct selection mode by either
clicking on the direct select tool in the layer controls panel or pressing the
D key while the shapes layer is selected. To move a vertex, you can click and
drag it to its new position.
You can add vertices to a selected shape using the vertex addition tool which
can be selected either clicking on the vertex addition tool in the layer
controls panel or pressing the I key while the shapes layer is selected.
You can delete vertices to a selected shape using the vertex deletion tool which
can be selected either clicking on the vertex deletion tool in the layer
controls panel or pressing the X key while the shapes layer is selected.
For example see below:
Changing shape edge and face colors#
Individual shapes can each have different edge and face colors. You can
initially set these colors by providing a list of colors to the edge_color or
face_color keyword arguments respectively, or you can edit them from the GUI.
The colors of each of the shapes are available as lists under the
layer.edge_color and layer.face_color properties. These properties are
different from the layer.current_edge_color and layer.current_face_color
properties that will determine the color of the next shape to be added or any
currently selected shapes.
To change the shape color properties from the GUI you must first select the shape whose properties you want to change, otherwise you will just be initializing the property for the next shape you add.
Changing shape edge widths#
Individual shapes can each have different edge widths. You can initially set the
edge widths by providing a list of values to the edge_width keyword arguments
respectively, or you can edit them from the GUI. The widths of each of the
shapes are available as a list under the layer.edge_width property. Similar
to the edge and face colors, these property is different from the
layer.current_edge_width property that will determine the edge width of the
next shape to be added or any currently selected shapes.
To change the edge with property from the GUI you must first select the shape whose properties you want to change, otherwise you will just be initializing the property for the next shape you add.
Layer ordering#
You can adjust the ordering of shapes in the layer by selecting shapes and then
clicking the move to front or move to back buttons. You can get the ordering of
all the shapes using the layer.z_indices property. You can also set the
initial ordering of shapes by passing a list to the layer.z_index property.
Copying and pasting shapes#
It is possible to copy and paste any selected shapes using the ctrl-C and
ctrl-V keybindings respectively. If you have a multidimensional shapes layer
you can copy shapes from one slice to another by pasting them into the new
slice. The coordinates of the shapes in the visible dimensions will be in the
same place on the new slice as in the old slice, but the rest of the coordinates
will be updated with the new slice values.
Shapes layer opacity#
The opacity value applies to all shapes. You can
initialize the shape opacities using the opacity keyword argument which
accepts a single opacity value that will be applied globally. You can then
access the opacity using the layer.opacity property. In order to adjust the
opacity of individual shapes you need to adjust the alpha value in the
layer.edge_color and layer.face_color properties.
Putting it all together#
Here you can see an example of adding, selecting, and editing shapes and change their properties: