Goal: Set up your environment, get an overview of the workshop, and learn your way around the napari viewer — from the GUI essentials to running example scripts.
Welcome
Introduce instructors and helpers
Share the Code of Conduct
Share the Zulip #napari-workshop-[DATE] thread
post an introduction: “What field are you from, and what kind of images do you work with?”
Ask about accessibility needs (private DMs on Zulip will be monitored)
Workshop Overview
This workshop has four blocks:
| Block | Topic |
|---|---|
| 1 | Welcome and GUI Walkthrough — get oriented in the napari viewer |
| 2 | Python, Data, and Metadata — control napari from Python, set physical scales, work with xarray and Zarr |
| 3 | Custom Widgets and Interactions — build interactive GUIs with magicgui, layer events, and mouse callbacks |
| 4 | From Script to Plugin — package your custom tools as pip-installable napari plugins |
With everything from microscopes to telescopes to satellites, scientists produce image data in countless formats, shapes, sizes, and dimensions. napari is a Python library for multidimensional image visualization, but it does double duty as a standalone application that can be easily extended with GUI tools for analysis, visualization, and annotation.
In this tutorial, we’ll start with the basics of image visualization and analysis in napari, then show how to extend the napari user interface to make analysis workflows as easy as pushing a button, and finally show how to share these extensions as plugins, which can be easily installed by users and collaborators.
About napari
napari is a free, open-source, multi-dimensional image viewer for Python. It is:
Community-driven — built by scientists, for scientists
Extensible — hundreds of plugins on napari-hub.org
Interoperable — works with NumPy, xarray, Zarr, TIFF, and more
Interactive — explore and annotate your data with a GUI or from Python
What Are Images?
A quick conceptual grounding before we open our first image:
Before diving into napari, a quick conceptual grounding:
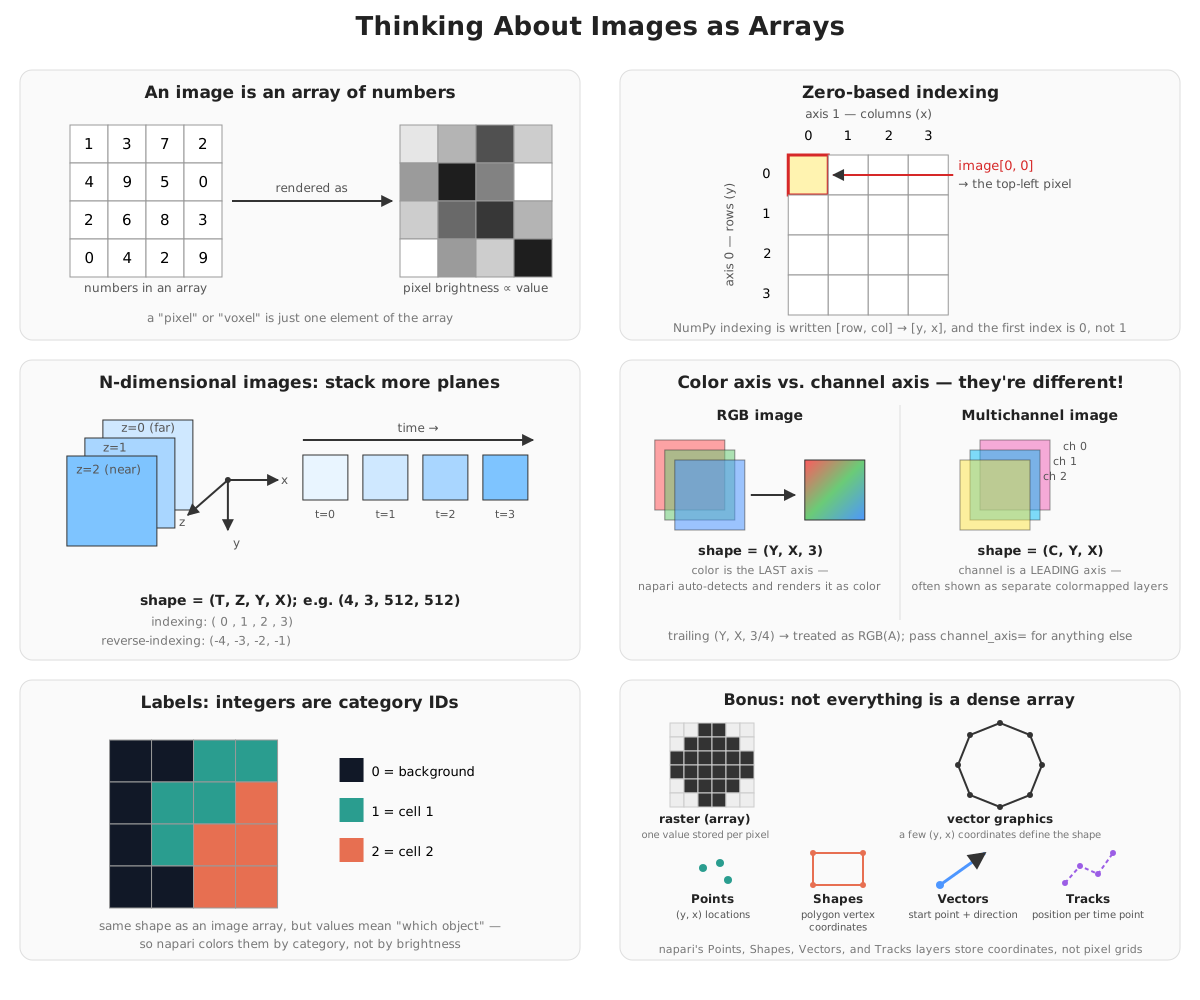
Images are arrays of numbers — each pixel has a value (brightness, intensity)
n-dimensional images — beyond rows and columns in an array, images can have more array indexes
zero-based indexing — the first element/pixel is at position 0, not 1
A common (but not universal) convention: TZYX ordering for time, depth, height, and width dimensions
multi-channel images — can be just another dimension in the array (e.g. RGB(A) is shape height, width, 3 (or 4))
labels — images where pixel values are integers representing categories (e.g. 0=background, 1=cell1, 2=cell2, etc.)
scale and units — each pixel corresponds to a real-world physical size
napari can display all of these — the dimension sliders let you navigate indexes beyond the 2D canvas.
Open Your First Image
Let’s get the viewer up and running with a sample dataset:
pixi run -e extend napariIn napari, select: File > Open Sample > napari builtins > Cells (3D + 2Ch)
Two layers appear in the layer list:
membraneandnucleiUse the dimension slider at the bottom to scroll through z-slices
Toggle each layer on/off with the eye icon next to its name
What you’re looking at: Confocal microscopy images of cells in 3D. The
nucleichannel (channel 1) shows cell nuclei stained with a dye. Themembranechannel (channel 0) shows cell membranes.
Screenshots
Save what you see in napari at any time:
File > Save Screenshot... — saves the canvas as an image file
File > Save Screenshot with Viewer — saves the canvas plus the entire GUI
File > Copy Screenshot to Clipboard — paste it directly into a document or chat
Keyboard shortcut: Alt+S (saves to file) or Alt+C (copies to clipboard).
Add Shift to include the viewer UI: Alt+Shift+S or Alt+Shift+C.
GUI Essentials Walkthrough
Follow along as we walk through the major parts of the napari interface.
The Viewer Layout
| Area | Purpose |
|---|---|
| Canvas (center) | Where your image is displayed |
| Dimension sliders (bottom) | Scrub through z, t, or other axes beyond 2D |
| Viewer buttons (bottom-left) | 2D/3D toggle, home, grid, axes, scale bar |
| Layer list (left) | All open layers; click to select, eye to toggle visibility |
| Layer controls (top-left) | Adjust appearance of the selected layer |
Key Interactions
Canvas zoom: right-click and drag or scroll wheel (two-finger scroll on trackpad)
Pan: click and drag on the canvas — hold Shift to pan in 3D mode
Reset view: click the home button in the viewer button row (bottom-left)
Dimension Sliders
When a layer has more dimensions than the two displayed on the canvas, sliders appear at the bottom. Drag a slider to move through z-slices, time points, or channels.
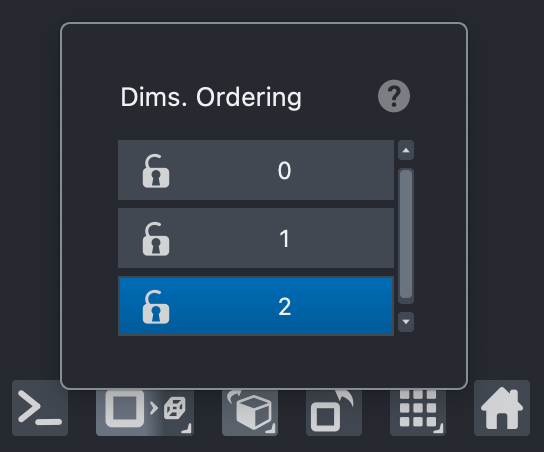
You can rename the slider labels! Right-click the roll dimensions button (bottom-left) and double-click an axis label to edit it.
2D ↔ 3D Toggle
Click the 2D/3D button in the viewer button row to switch rendering modes. In 3D mode, click-drag to rotate the volume. Give it a try!

Overlays
napari can display helpful overlays on the canvas. Here are the most useful ones:
Scene Axes: View > Scene Axes > Toggle Scene Axes — shows the x/y/z axes in 3D.
Canvas Axes: View > Canvas Axes > Toggle Canvas Axes — shows axis labels in the corner of the canvas.
Scale bar: View > Scale Bar > Toggle Scale Bar — displays the physical scale in real-world units. We’ll set units in Block 2.
Color bar: Right-click a layer or use Layers > Measure > Color Bar — shows the colormap-to-intensity mapping for the selected layer.
Layer Controls
With a layer selected in the layer list, the layer controls panel (top-left) lets you change how that layer appears. The most important controls:
Contrast limits — the brightness range; drag the sliders or click “auto”
Colormap — the colour used to map intensity values to pixels
Blending — how overlapping layers are composited (try
additive!)Opacity — layer transparency from 0 (invisible) to 1 (fully opaque)
Try adjusting these controls yourself — change the colormap of nuclei, lower
the opacity of membrane, or switch the blending mode to additive. The
changes are immediate, which makes exploring your data fast and intuitive.
Console Peek
napari has a built-in Python console — open it from Window > Console or click the leftmost viewer button. It lets you interact with the viewer programmatically while you explore:
# Type this in the console and press Enter:
viewer.layers['nuclei'].colormap = 'viridis'
The console gives you access to the full napari Python API without leaving the GUI. It’s the bridge between point-and-click exploration and scripted analysis.
Opening Files from the Command Line
napari can also run Python scripts — it reads them and executes them in the viewer. This is a great way to explore the napari gallery examples:
pixi run -e extend napari demos/everything.pyDrag-and-drop works too: download any .py file from the
napari gallery and drop it onto the
napari canvas. napari runs it automatically.
Speaking of which…
Gallery Exploration Breakout
Recommended Examples
Displaying Xarray data in napari
Interactive Control Over Parallel Computations
Set Multiscale Resolution Level
Surface with texture and vertex colors
3D Vector field and image across time
Heart with multiple annotations
Tracks 3D
Surface with multiple textures
Sharing Time
What did you find in the gallery? (check the Zulip stream for screenshots!)
Any surprising layer types or visualizations?
Questions about the interface before we dive into Python?
In Block 2, we’ll switch from clicking to coding — controlling napari entirely from Python, loading our own data, and setting physical scales for real-world measurements.