Note
Go to the end to download the full example as a Python script or as a Jupyter notebook.
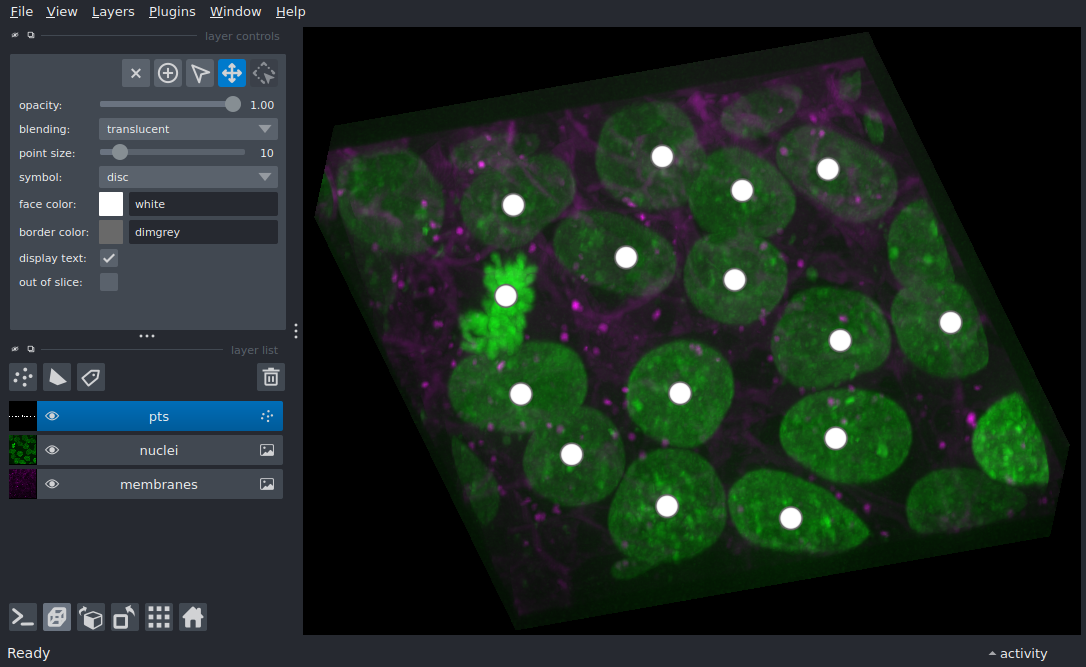
Image points 3D#
Display points overlaid on a 3D image
from skimage import data, feature, filters

import napari

cells = data.cells3d()
nuclei = cells[:, 1]
smooth = filters.gaussian(nuclei, sigma=10)
pts = feature.peak_local_max(smooth)
viewer = napari.view_image(
        cells, channel_axis=1, name=['membranes', 'nuclei'], ndisplay=3
        )
viewer.add_points(pts)
viewer.camera.angles = (10, -20, 130)

if __name__ == '__main__':
    napari.run()