Note
Click here to download the full example code
Mixed dimensions labels
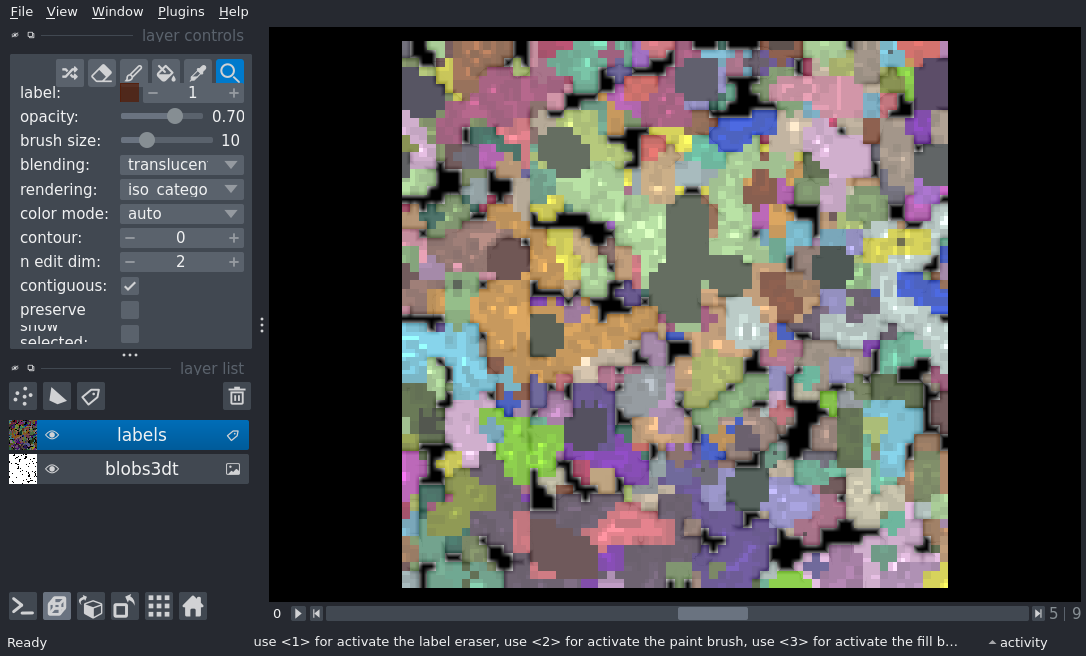
Overlay a 3D segmentation on a 4D time series.
Sometimes, our data have mixed dimensionality. napari “right-aligns” the dimensions of your data, following NumPy broadcasting conventions 1. In this example, we show how we can see a 3D segmentation overlaid on a 4D dataset. As we slice through the dataset, the segmentation stays unchanged, but is visible on every slice.

from skimage.data import binary_blobs
from scipy import ndimage as ndi
import numpy as np
import napari

blobs3d = binary_blobs(length=64, volume_fraction=0.1, n_dim=3).astype(float)

blobs3dt = np.stack([np.roll(blobs3d, 3 * i, axis=2) for i in range(10)])

labels = ndi.label(blobs3dt[5])[0]

viewer = napari.Viewer(ndisplay=3)

image_layer = viewer.add_image(blobs3dt)
labels_layer = viewer.add_labels(labels)
viewer.dims.current_step = (5, 0, 0, 0)

if __name__ == '__main__':
    napari.run()